


Plotting freeware
Plotting
Released: December 10, 2012
|
Added: December 10, 2012 | Visits: 511
 APLpy (the Astronomical Plotting Library in Python) is a Python module aimed at producing publication-quality plots of astronomical imaging data in FITS format. Visit http://aplpy.sourceforge.net/ for tutorials and documentation.
Platforms: Mac, Linux
| License: Freeware | Size: 55.36 KB | Download (46): APLpy (Astronomical Plotting in Python) Download |
Released: November 18, 2012
|
Added: November 18, 2012 | Visits: 418
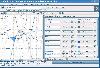 FunkyPlot is an interactive plotting tool for mathematical functions, designed for pupils and students.
Platforms: Windows, Mac, Linux
| License: Freeware | Size: 776.03 KB | Download (50): FunkyPlot - Math. Function Plotting Download |
Released: December 16, 2012
|
Added: December 16, 2012 | Visits: 544
JPlot is a multi-purpose data plotting program for use as the graphic front-end of (scientific) software. JPlot is also available as a stand-alone application with a complete and easy-to-use graphic user interface (GUI).
Platforms: Windows, Mac, Linux
| License: Freeware | Size: 313.12 KB | Download (46): JPlot -- Graphical plotting software Download |
Released: June 12, 2012
|
Added: June 12, 2012 | Visits: 520
Narrative is a Mac OS X native plotting framework written with the Cocoa API. It is already capable (see, e.g., www.trade-strategist.com), but will evolve into a complete OO solution to plotting in Cocoa and GNUStep.
Platforms: Mac, BSD, Linux
| License: Freeware | Size: 279 KB | Download (52): Narrative -- Cocoa Plotting Framework Download |
Released: November 15, 2012
|
Added: November 15, 2012 | Visits: 388
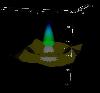
 Periscope is a 3D plotting library written in C++ on top of VTK. It provides an abstract interface for creating 3D plots.
Platforms: Windows, Mac, BSD, Linux
| License: Freeware | Size: 369.29 KB | Download (58): Periscope 3D Plotting Library Download |
Released: July 10, 2012
|
Added: July 10, 2012 | Visits: 419
 Pyllar is a 3D plotting library for the Python programming language. It uses the Visualization Toolkit (VTK) and PyNum library provide high quality 3D plots for science and engineering.
Platforms: Windows, Mac, Linux
| License: Freeware | Size: 490.86 KB | Download (48): Pyllar Plotting Library Download |
Added: May 08, 2013 | Visits: 458
mPlot is an enhanced plotting engine that extends the basic plotting functionality delivered with Matlab. The purpose of mPlot is to consolidate daily plotting and formatting tasks into a single, easy-to-use object. Provided within the class are both high-level and low-level functionality. The...
Platforms: Matlab
| License: Freeware | Size: 10 KB | Download (41): mPlot - Enhanced Plotting Engine Download |
Added: September 22, 2013 | Visits: 616
The Function Plotting and Data Fitting Model allows you to create customizable plots to interactively explore the properties of up to three functions at a time. When you enter a function, adjustable parameters are automatically recognized, and sliders are created to vary the values of these...
Platforms: Mac
| License: Freeware | Size: 1.41 MB | Download (42): Function Plotting and Data Fitting Model Download |
Added: October 05, 2010 | Visits: 958
PlotMM is an extension to GTKmm which provides a 2D data plotting widget. PlotMM is an extension to the gtkmm library. It contains widgets which are primarily useful for technical and scientifical purposes. For the beginning, this is a 2-D plotting widget (see screenshot above)..
Platforms: *nix
| License: Freeware | Size: 471.04 KB | Download (101): PlotMM Download |
Added: October 14, 2010 | Visits: 1.654
GD::Graph is a graph plotting module for Perl 5. SYNOPSIS use GD::Graph::moduleName; GD::Graph is a perl5 module to create charts using the GD module. The following classes for graphs with axes are defined: GD::Graph::lines Create a line chart. GD::Graph::bars and GD::Graph::hbars...
Platforms: *nix
| License: Freeware | Size: 143.36 KB | Download (111): GD::Graph Download |
Added: November 09, 2010 | Visits: 1.193
Chart::PNGgraph is a graph plotting module (deprecated). SYNOPSIS use Chart::PNGgraph::moduleName; Chart::PNGgraph is a perl5 module to create PNG output for a graph. Chart::PNGgraph is nothing more than a wrapper around GD::Graph, and its use is deprecated. It only exists for backward...
Platforms: *nix
| License: Freeware | Size: 33.79 KB | Download (110): Chart::PNGgraph Download |
Added: March 03, 2010 | Visits: 1.000
jgnuplot project is a Java library for interfacing with the gnuplot plotting package which outputs to X11, PostScript, PNG, GIF and other formats. This library generates temporary gnuplot files which result in plots in specified output files. The jar files can be build with the command: $...
Platforms: *nix
| License: Freeware | Size: 20.48 KB | Download (94): jgnuplot Download |
Added: October 13, 2010 | Visits: 985
RLPlot project is is a plotting program to create high quality graphs from data. Based on values stored in a spreadsheet several menus help you to create graphs of your choice. The Graphs are displayed as you get them (WYSIWIG). Double click any element of the graph (or a single click with the...
Platforms: *nix
| License: Freeware | Size: 993.28 KB | Download (106): RLPlot Download |
Released: November 04, 2012
|
Added: November 04, 2012 | Visits: 551
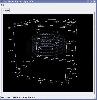
MOPlot is a handy visualization application specially designed for fast molecular orbitals plotting from the outputs of the Gaussian 03/98/94, Molcas, Gamess/US quantum chemical calculation packages. This Molecular Orbital Plotting Program will prove to be easy-to-use and very efficient.
MOPlot...
Platforms: Windows, XP
| License: Freeware | Download (478): MOPlot Download |
Released: August 19, 2012
|
Added: August 19, 2012 | Visits: 396
The Plot.py project tries to supply an easy to use measurement data visualization and treatment framework being easy to use while keeping the freedom for advanced users to execute additional data treatment algorithms. The program is build on a object oriented modular basis to provide the...
Platforms: Linux
| License: Freeware | Download (441): Plotting GUI for Linux Download |
Released: November 26, 2012
|
Added: November 26, 2012 | Visits: 377
The Plot.py project tries to supply an easy to use measurement data visualization and treatment framework being easy to use while keeping the freedom for advanced users to execute additional data treatment algorithms. The program is build on a object oriented modular basis to provide the...
Platforms: Windows
| License: Freeware | Size: 41.9 MB | Download (503): Plotting GUI Download |
Released: October 08, 2012
|
Added: October 08, 2012 | Visits: 518
 GreatCirc is a tool for calculating Great Circle distances on the earth's surface, and plotting points and great circle paths on a world map.
The "great circle path" is the shortest direct route between two points on the earth's surface. Because the earth is a globe, the shortest path between...
GreatCirc is a tool for calculating Great Circle distances on the earth's surface, and plotting points and great circle paths on a world map.
The "great circle path" is the shortest direct route between two points on the earth's surface. Because the earth is a globe, the shortest path between...
Platforms: Windows
| License: Freeware | Size: 2.2 MB | Download (455): GreatCirc Download |
Released: November 19, 2012
|
Added: November 19, 2012 | Visits: 341
 The Plot.py project tries to supply an easy to use measurement data visualization and treatment framework being easy to use while keeping the freedom for advanced users to execute additional data treatment algorithms. The program is build on a object oriented modular basis to provide the...
Platforms: Linux
| License: Freeware | Size: 850 KB | Download (485): Plotting GUI for Linux 0.7.13 Beta Download |
Added: May 10, 2013 | Visits: 389
matplotlib is a python 2D plotting library which produces publication quality figures in a variety of hardcopy formats and interactive environments across platforms. matplotlib can be used in python scripts, the python and ipython shell (ala matlab or mathematica), web application servers, and...
Platforms: Windows, Mac, *nix, Python, BSD Solaris
| License: Freeware | Download (49): Matplotlib Download |
Added: May 10, 2013 | Visits: 532
PlotKit is a Chart and Graph Plotting Library for Javascript. It has support for HTML Canvas and also SVG via Adobe SVG Viewer and native browser support. PlotKit is fully documented and there is also a quick tutorial to get you started. PlotKit is a complete rewrite of CanvasGraph. It is better...
Platforms: Windows, Mac, *nix, JavaScript, BSD Solaris
| License: Freeware | Download (65): PlotKit Download |