


Plotting freeware
Plotting
Released: October 11, 2012
|
Added: October 11, 2012 | Visits: 206
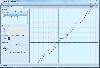 Graficas 2D is an opensource library for plotting 2D functions. It's compatible with .NET Framework and Mono
Platforms: Windows, Mac, Linux
Graficas 2D is an opensource library for plotting 2D functions. It's compatible with .NET Framework and Mono
Platforms: Windows, Mac, Linux
| License: Freeware | Size: 72.75 KB | Download (48): Graficas 2D Download |
Released: November 14, 2012
|
Added: November 14, 2012 | Visits: 345
 Based on PyQwt (plotting widgets for PyQt4 graphical user interfaces) and on the scientific modules NumPy and SciPy, guiqwt is a Python library providing efficient 2D data-plotting features (curve/image visualization and related tools) for interactiv
Platforms: Windows, Mac, Linux
Based on PyQwt (plotting widgets for PyQt4 graphical user interfaces) and on the scientific modules NumPy and SciPy, guiqwt is a Python library providing efficient 2D data-plotting features (curve/image visualization and related tools) for interactiv
Platforms: Windows, Mac, Linux
| License: Freeware | Size: 2.54 MB | Download (48): guiqwt Download |
Released: November 21, 2012
|
Added: November 21, 2012 | Visits: 324
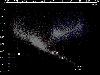 Educational astrometry utility for plotting stars on a Hertzsprung-Russel diagram. Useful for learning about stellar spectra and properties and performing spectroscopic parallax calculations, as found in many high school physics courses.
Platforms: Windows, Mac, BSD, Linux
Educational astrometry utility for plotting stars on a Hertzsprung-Russel diagram. Useful for learning about stellar spectra and properties and performing spectroscopic parallax calculations, as found in many high school physics courses.
Platforms: Windows, Mac, BSD, Linux
| License: Freeware | Size: 4.59 MB | Download (46): Henry Download |
Released: October 14, 2012
|
Added: October 14, 2012 | Visits: 249
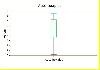
 jmathplot is a light java library designed to allow easy plotting of 2D and 3D datas in a java panel.
Platforms: Windows, Mac, Linux
jmathplot is a light java library designed to allow easy plotting of 2D and 3D datas in a java panel.
Platforms: Windows, Mac, Linux
| License: Freeware | Size: 79.46 KB | Download (50): jmathplot Download |
Released: September 04, 2012
|
Added: September 04, 2012 | Visits: 353
JPlot is a multi-purpose data plotting program for use as the graphic front-end of (scientific) software. JPlot is also available as a stand-alone application with a complete and easy-to-use graphic user interface (GUI).
Platforms: Windows, Mac, Linux
| License: Freeware | Size: 2.77 MB | Download (47): JPlot Download |
Released: July 15, 2012
|
Added: July 15, 2012 | Visits: 206
A documented, maintained, and easy to use java library for plotting various statistical and mathematical graphs.
Platforms: Windows, Mac, Linux
| License: Freeware | Size: 4.92 KB | Download (49): JStatPlot Download |
Released: September 03, 2012
|
Added: September 03, 2012 | Visits: 310
Jvmstat Chartist is a GUI application for simple analytic processing and plotting metrics collected by Sun's jvmstat utility.
Platforms: Windows, Mac, Linux
| License: Freeware | Size: 1.21 MB | Download (49): Jvmstat Chartist Download |
Released: October 18, 2012
|
Added: October 18, 2012 | Visits: 454
ActiveGEM contains a set of perl/Tk graphical interfaces for the GEMPAK meteorological diagnostics and plotting package. These research-oriented interfaces provide easy access to low-level GEMPAK functions and allow for the maximum possible flexibility.
Platforms: Windows, Mac, Linux
| License: Freeware | Size: 497.69 KB | Download (47): MRG Interactive ActiveGEM GEMPAK GUI Download |
Released: October 12, 2012
|
Added: October 12, 2012 | Visits: 327
PERL Plot : Plotting program for DSP and Communications. Includes multi-column, scatter,bar,pole-zero,eye diagrams, log-log, polar , polar db and other plot types.
Platforms: Windows, Mac, BSD, Linux
| License: Freeware | Size: 165.18 KB | Download (47): prlplot Download |
Released: July 12, 2012
|
Added: July 12, 2012 | Visits: 356
PyXPlot is a command-line data processing, graph plotting and vector graphics tool.
Platforms: Mac, Solaris, Linux
| License: Freeware | Size: 3.67 MB | Download (46): PyXPlot Download |
Released: July 15, 2012
|
Added: July 15, 2012 | Visits: 290
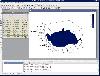 SciDAVis is a user-friendly data analysis and visualization program primarily aimed at high-quality plotting of scientific data. It strives to combine an intuitive, easy-to-use graphical user interface with powerful features such as Python scriptability.
Platforms: Windows, Mac, Linux
SciDAVis is a user-friendly data analysis and visualization program primarily aimed at high-quality plotting of scientific data. It strives to combine an intuitive, easy-to-use graphical user interface with powerful features such as Python scriptability.
Platforms: Windows, Mac, Linux
| License: Freeware | Size: 15.14 MB | Download (48): SciDAVis Download |
Released: November 11, 2012
|
Added: November 11, 2012 | Visits: 406
SolarJ is a library of ephemeris routines, plotting routines, and applications for displaying features visible on the sun and planets in the solar system.
Platforms: Windows, Mac, Linux
| License: Freeware | Size: 3.72 KB | Download (49): SolarJ Download |
Released: July 02, 2012
|
Added: July 02, 2012 | Visits: 451
StrATo (Strain Analysis Tool) loads GE Vingmed heart strain value reports file and performs a statistical peak analysis and curve uniformity evaluation, cutting off sampled noise, plotting results and offering a printout to attach in medical reports.
Platforms: Windows, Mac, Linux
| License: Freeware | Size: 276.39 KB | Download (50): StrATo Download |
Released: October 16, 2012
|
Added: October 16, 2012 | Visits: 414
 The SVG_plot C++ library allows, with a few lines of C++ code, to add plotting of data, held in STL containers like vector and map, output as SVG files that can be viewed by all modern browers.
1D, 2D and Boxplots can be produced, and there are a myriad of options to control appearance.
The...
Platforms: Windows, Mac, Linux
The SVG_plot C++ library allows, with a few lines of C++ code, to add plotting of data, held in STL containers like vector and map, output as SVG files that can be viewed by all modern browers.
1D, 2D and Boxplots can be produced, and there are a myriad of options to control appearance.
The...
Platforms: Windows, Mac, Linux
| License: Freeware | Size: 6.35 MB | Download (49): SVG_plot Download |
Released: November 01, 2012
|
Added: November 01, 2012 | Visits: 264
About AquaTerm
A Mac OS X plotting front end (grahics terminal) written using Objective-C and the Cocoa API.
It allows other applications to display vector graphics and images using a simple API. This is useful for displaying graphics generated by old code natively in Aqua. AquaTerm will let you...
Platforms: Mac
| License: Freeware | Size: 235.52 KB | Download (48): AquaTerm Download |
Released: July 16, 2012
|
Added: July 16, 2012 | Visits: 459
 Charter is an application that easily allows to add plotting functionality to every scripting and programming language with a UDP socket library.
The only thing you need is to send an UDP packet containing the data to be plotted, which has to
Platforms: Mac
Charter is an application that easily allows to add plotting functionality to every scripting and programming language with a UDP socket library.
The only thing you need is to send an UDP packet containing the data to be plotted, which has to
Platforms: Mac
| License: Freeware | Size: 15.8 MB | Download (48): Charter Download |
Added: May 10, 2013 | Visits: 299
Timeplot is a DHTML-based AJAXy widget for plotting time series and overlay time-based events over them (with the same data formats that Timeline supports). The script is very easy to customize or to implement in your own projects.
Platforms: Windows, Mac, *nix, JavaScript, BSD Solaris
| License: Freeware | Download (53): Timeplot Download |
Added: May 10, 2013 | Visits: 320
The script is very efficient in plotting the distribution of compound Poisson/Lognormal. Requirements: - MATLAB 7.5 or higher
Platforms: Windows, Mac, *nix, Matlab, BSD Solaris
| License: Freeware | Download (52): Panjer Download |
Added: October 12, 2013 | Visits: 980
SciGraphica is a scientific data visualization and analysis application, supplying many of the basic plotting features for 2D and 3D charts. It features opening several worksheets and plots to work with at the same time and PS output.
Platforms: *nix
| License: Freeware | Size: 819.2 KB | Download (64): SciGraphica Download |
Added: May 10, 2013 | Visits: 312
PLplot is a cross-platform software package for creating scientific plots. To help accomplish that task it is organized as a core C library, language bindings for that library, and device drivers which control how the plots are presented in non-interactive and interactive plotting contexts. The...
Platforms: Windows, Mac, *nix, C/C++, BSD Solaris
| License: Freeware | Download (57): PLplot Download |