


Plotting freeware
Plotting
Released: November 27, 2012
|
Added: November 27, 2012 | Visits: 1.113
 MUD Map Designer is a tool that was developed for MUD programmers that wish to make maps for plotting or simply beneficial reasons. All files can be exported to several different image types. You can create your own setup files and map icons to use to customize each game! Here are some key...
Platforms: Windows
MUD Map Designer is a tool that was developed for MUD programmers that wish to make maps for plotting or simply beneficial reasons. All files can be exported to several different image types. You can create your own setup files and map icons to use to customize each game! Here are some key...
Platforms: Windows
| License: Freeware | Download (78): MUD Map Designer Download |
Released: October 03, 2012
|
Added: October 03, 2012 | Visits: 440
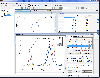
 Kst is the fastest real-time large-dataset viewing and plotting tool available (you may be interested in some benchmarks) and has built-in data analysis functionality. Kst is very user-friendly (both the community and the program itself!). Kst contains many powerful built-in features and is...
Platforms: Windows
Kst is the fastest real-time large-dataset viewing and plotting tool available (you may be interested in some benchmarks) and has built-in data analysis functionality. Kst is very user-friendly (both the community and the program itself!). Kst contains many powerful built-in features and is...
Platforms: Windows
| License: Freeware | Size: 10.1 MB | Download (454): Kst Download |
Released: November 17, 2012
|
Added: November 17, 2012 | Visits: 497
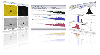
 MagicPlot is a handy tool for scientific and engineer data processing, plotting and nonlinear fitting. MagicPlot is powerful enough and consistent.
Advantages
* Compact: Single file ~2 MB
* Multilevel undo function for all actions
* Useful plot navigation and scaling
* Visual nonlinear...
Platforms: All
MagicPlot is a handy tool for scientific and engineer data processing, plotting and nonlinear fitting. MagicPlot is powerful enough and consistent.
Advantages
* Compact: Single file ~2 MB
* Multilevel undo function for all actions
* Useful plot navigation and scaling
* Visual nonlinear...
Platforms: All
| License: Freeware | Size: 2.2 MB | Download (483): MagicPlot Student for Linux Download |
Released: November 22, 2012
|
Added: November 22, 2012 | Visits: 578
 Sailcut CAD is a sail design and plotting software which allows you to design and visualise your own sail and compute the accurate development of all panels in flat sheets. The original Sailcut was a Basic program developped by Robert Lainé in 1978. The new version, called Sailcut CAD, is...
Platforms: Mac
Sailcut CAD is a sail design and plotting software which allows you to design and visualise your own sail and compute the accurate development of all panels in flat sheets. The original Sailcut was a Basic program developped by Robert Lainé in 1978. The new version, called Sailcut CAD, is...
Platforms: Mac
| License: Freeware | Download (510): Sailcut CAD for Mac OS X Download |
Released: June 19, 2012
|
Added: June 19, 2012 | Visits: 541
Sailcut CAD is a sail design and plotting software which allows you to design and visualise your own sail and compute the accurate development of all panels in flat sheets. The original Sailcut was a Basic program developped by Robert Lainé in 1978. The new version, called Sailcut CAD, is...
Platforms: Windows
| License: Freeware | Size: 5.6 MB | Download (423): Sailcut CAD Download |
Released: November 14, 2012
|
Added: November 14, 2012 | Visits: 475
 Kst is the fastest real-time large-dataset viewing and plotting tool available (you may be interested in some benchmarks) and has built-in data analysis functionality. Kst is very user-friendly (both the community and the program itself!). Kst contains many powerful built-in features and is...
Platforms: Mac
Kst is the fastest real-time large-dataset viewing and plotting tool available (you may be interested in some benchmarks) and has built-in data analysis functionality. Kst is very user-friendly (both the community and the program itself!). Kst contains many powerful built-in features and is...
Platforms: Mac
| License: Freeware | Size: 22.9 MB | Download (482): Kst for Mac OS X Download |
Released: June 10, 2012
|
Added: June 10, 2012 | Visits: 391
ZeGrapher was designed to be a fast an easy-to-use mathematical function plotting application.
This handy tool can be specially suitable for high school students that need to plot different functions.
Platforms: Windows, Windows Vista, 7
| License: Freeware | Download (422): ZeGrapher Download |
Released: August 08, 2012
|
Added: August 08, 2012 | Visits: 474
 Veusz is a GUI scientific plotting and graphing package. It is designed to produce publication-ready Postscript or PDF output. SVG, EMF and bitmap export formats are also supported. The program runs under Unix/Linux, Windows or Mac OS X, and binaries are provided. Data can be read from text, CSV...
Platforms: Mac
Veusz is a GUI scientific plotting and graphing package. It is designed to produce publication-ready Postscript or PDF output. SVG, EMF and bitmap export formats are also supported. The program runs under Unix/Linux, Windows or Mac OS X, and binaries are provided. Data can be read from text, CSV...
Platforms: Mac
| License: Freeware | Size: 10.2 MB | Download (432): Veusz for Mac OS X Download |
Released: September 05, 2012
|
Added: September 05, 2012 | Visits: 391
StickFigure was specially designed as an accessible Matlab-based Graphical User Interface utility for plotting and animating data from C3D files.
These are Vicon trials, containing motion captured coordinate data. The program is mainly intended for use in the field of biomechanical analysis.
Platforms: Windows
| License: Freeware | Download (442): StickFigure Download |
Released: September 10, 2012
|
Added: September 10, 2012 | Visits: 426
 Veusz is a GUI scientific plotting and graphing package. It is designed to produce publication-ready Postscript or PDF output. SVG, EMF and bitmap export formats are also supported. The program runs under Unix/Linux, Windows or Mac OS X, and binaries are provided. Data can be read from text, CSV...
Platforms: Linux
Veusz is a GUI scientific plotting and graphing package. It is designed to produce publication-ready Postscript or PDF output. SVG, EMF and bitmap export formats are also supported. The program runs under Unix/Linux, Windows or Mac OS X, and binaries are provided. Data can be read from text, CSV...
Platforms: Linux
| License: Freeware | Size: 10.2 MB | Download (451): Veusz for Linux Download |
Released: October 25, 2012
|
Added: October 25, 2012 | Visits: 500
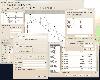
 RLPlot is is a plotting program to create high quality graphs from data. Based on values stored in a spreadsheet several menus help you to create graphs of your choice. The Graphs are displayed as you get them (wysiwyg). Double click any element of the graph (or a single click with the right...
Platforms: Windows
RLPlot is is a plotting program to create high quality graphs from data. Based on values stored in a spreadsheet several menus help you to create graphs of your choice. The Graphs are displayed as you get them (wysiwyg). Double click any element of the graph (or a single click with the right...
Platforms: Windows
| License: Freeware | Size: 1.2 MB | Download (455): RLPlot for Mac OS X Download |
Released: November 04, 2012
|
Added: November 04, 2012 | Visits: 372
MathGL is ...
* a library for making high-quality scientific graphics under Linux and Windows;
* a library for the fast data plotting and handling of large data arrays;
* a library for working in window and console modes and for easy embedding into other programs;
* a library with large and...
Platforms: Windows
| License: Freeware | Size: 3.8 MB | Download (51): MathGL Download |
Released: August 01, 2012
|
Added: August 01, 2012 | Visits: 323
MathGL is ...
* a library for making high-quality scientific graphics under Linux and Windows;
* a library for the fast data plotting and handling of large data arrays;
* a library for working in window and console modes and for easy embedding into other programs;
* a library with large and...
Platforms: Mac, Linux
| License: Freeware | Size: 3.8 MB | Download (45): MathGL for Mac OS X & Linux Download |
Released: July 16, 2012
|
Added: July 16, 2012 | Visits: 481
OxyPlot is a .NET library designed for plotting applications. It was created with focus on simplicity and performance.
The library contains custom controls for WPF, Silverlight and Windows Forms and includes exporters for SVG, PDF, XPS and PNG.
Platforms: Windows
| License: Freeware | Download (44): OxyPlot Download |
Released: September 12, 2012
|
Added: September 12, 2012 | Visits: 508
 Versatile Biorhythm plotting software with user friendly interface and print option for generated graphs and report. Full month graphical display of Primary (Physical, Emotional and Intellectual) and Secondary (Intuitional (or Intuitive), Aesthetic, (Self)Awareness and Spiritual) cycles....
Platforms: Windows
Versatile Biorhythm plotting software with user friendly interface and print option for generated graphs and report. Full month graphical display of Primary (Physical, Emotional and Intellectual) and Secondary (Intuitional (or Intuitive), Aesthetic, (Self)Awareness and Spiritual) cycles....
Platforms: Windows
| License: Freeware | Size: 482 KB | Download (47): RitmoView Free Download |
Released: June 01, 2012
|
Added: June 01, 2012 | Visits: 467
 ChSciTE is a Ch programming language IDE (Integrated Development Environment ) to edit and run C, Ch and C++ programs. Ch is an embeddable C/C++ interpreter for cross-platform scripting, shell programming, 2D/3D plotting, numerical computing and embedded scripting. It supports international...
Platforms: Windows, Mac, Unix, Linux, Pocket PC
ChSciTE is a Ch programming language IDE (Integrated Development Environment ) to edit and run C, Ch and C++ programs. Ch is an embeddable C/C++ interpreter for cross-platform scripting, shell programming, 2D/3D plotting, numerical computing and embedded scripting. It supports international...
Platforms: Windows, Mac, Unix, Linux, Pocket PC
| License: Freeware | Size: 1.85 MB | Download (45): ChScite Download |
Released: October 03, 2012
|
Added: October 03, 2012 | Visits: 568
 An Airfoil plotting program for model aircraft
Tracfoil features include where it can draw shetting thickness, Leading Edge (V-notch square stock), Trailing Edge.Build 12 spars rectangular or rond (location in units ou % from L.E or T.E, at position under airfoil, under sheeting ).Build 12 holes...
Platforms: Windows
An Airfoil plotting program for model aircraft
Tracfoil features include where it can draw shetting thickness, Leading Edge (V-notch square stock), Trailing Edge.Build 12 spars rectangular or rond (location in units ou % from L.E or T.E, at position under airfoil, under sheeting ).Build 12 holes...
Platforms: Windows
| License: Freeware | Size: 1.5 MB | Download (451): Tracfoil Download |
Released: November 18, 2012
|
Added: November 18, 2012 | Visits: 356
 A Perl object-oriented library for plotting graphs with Gnuplot.
Platforms: Windows, Mac, Linux
A Perl object-oriented library for plotting graphs with Gnuplot.
Platforms: Windows, Mac, Linux
| License: Freeware | Size: 38.61 KB | Download (44): Chart Gnuplot Download |
Released: September 24, 2012
|
Added: September 24, 2012 | Visits: 283
A Python interface to the gnuplot plotting program.
Platforms: Windows, Mac, Linux
| License: Freeware | Size: 116.04 KB | Download (44): Gnuplot.py Download |
Released: June 13, 2012
|
Added: June 13, 2012 | Visits: 209
 Gnupylot is a GUI for gnuplot (the widely used multi-OS plotting utility). It's written in Python using PyQt4 libraries. With Gnupylot you can save your plots (even the datasets). It's still in Alpha stage.
Platforms: Windows, Mac, Linux
Gnupylot is a GUI for gnuplot (the widely used multi-OS plotting utility). It's written in Python using PyQt4 libraries. With Gnupylot you can save your plots (even the datasets). It's still in Alpha stage.
Platforms: Windows, Mac, Linux
| License: Freeware | Size: 762.58 KB | Download (49): Gnupylot Download |