


Plots freeware
Plots
Released: November 11, 2012
|
Added: November 11, 2012 | Visits: 394
 PHPlot is a PHP graphics class for creating charts and plots. It works with PHP5 and the PHP GD extension to produce PNG, GIF, or JPEG images. TrueType fonts (TTF) are optional, or built-in GD fonts can be used. The available plot types include: area, bars, line/points, lines, pie, points,...
Platforms: Windows, Mac, Linux
PHPlot is a PHP graphics class for creating charts and plots. It works with PHP5 and the PHP GD extension to produce PNG, GIF, or JPEG images. TrueType fonts (TTF) are optional, or built-in GD fonts can be used. The available plot types include: area, bars, line/points, lines, pie, points,...
Platforms: Windows, Mac, Linux
| License: Freeware | Size: 159.35 KB | Download (48): PHPlot Download |
Released: October 21, 2012
|
Added: October 21, 2012 | Visits: 322
 PyPlotSuite aims to provide immediate, easy-to-use, GUI tools to display, analyze and create publication-quality 2D plots of 1D data series, images, 2D arrays. This project is based on (and would not exist without) pygtk, matplotlib and numpy.
Platforms: Windows, Mac, Linux
PyPlotSuite aims to provide immediate, easy-to-use, GUI tools to display, analyze and create publication-quality 2D plots of 1D data series, images, 2D arrays. This project is based on (and would not exist without) pygtk, matplotlib and numpy.
Platforms: Windows, Mac, Linux
| License: Freeware | Size: 747.38 KB | Download (48): PyPlotSuite Download |
Added: June 18, 2013 | Visits: 441
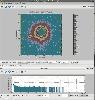
The Spherical Self-Organizing Feature Maps is a contemporary technique for data clustering and visualization.The main advantages they offer are the following:1. Smooth training2. Implementation in arbitrary dimension without additional computational cost.3. Data visualization in arbitrary...
Platforms: Matlab
| License: Freeware | Size: 6.18 MB | Download (48): S-SOFM Toolbox Download |
Added: August 04, 2013 | Visits: 393
FIG2XLS converts all open figures to Excel charts. Only scatter 2-D plots are supported. One chart and one sheet are created per subplot. FIG2XLS(FIGS) converts just figure numbers FIGS. Within the limits of Excel, most figure properties are converted.
Platforms: Matlab
| License: Freeware | Size: 10 KB | Download (48): fig2xls Download |
Added: May 02, 2013 | Visits: 494
Graphist presents plots of data as GIF, JPEG, or PNG images. Though PHP is used by Graphist to produce the image, pages that use its images can be ordinary HTML.These images are added to a web page the same way as any image, such as a corporate logo or picture of your dog: an IMG tag.The tag's...
Platforms: PHP
| License: Freeware | Size: 10 KB | Download (48): Graphist for Scripts Download |
Added: April 17, 2013 | Visits: 617
The GUI application plots VLE data of ethanol-water mixture at various pressures. Both Txy and xy diagrams can be plotted at the pressure value specified by the user. The Wilson model allows the program to take into account the deviation from ideal behavior in the liquid phase. User should enter...
Platforms: Matlab
| License: Freeware | Size: 10 KB | Download (47): Isobaric vapor-liquid diagram using GUI Download |
Added: July 30, 2013 | Visits: 649
A very simple function which uses the DataFeed toolbox to retrieve stock prices for a specified number of days from the Yahoo service and plots them.e.g. to see how your Microsoft shares have done over the last three months, just type:>> show_chart('MSFT',90)
Platforms: Matlab
| License: Freeware | Size: 10 KB | Download (47): Plot Stock Prices Download |
Released: October 27, 2012
|
Added: October 27, 2012 | Visits: 576
 GLE (Graphics Layout Engine) is a graphics scripting language designed for creating publication quality graphs, plots, diagrams, figures and slides. GLE supports various graph types (function plots, histograms, bar graphs, scatter plots, contour lines, color maps, surface plots, ...) through a...
Platforms: Mac
GLE (Graphics Layout Engine) is a graphics scripting language designed for creating publication quality graphs, plots, diagrams, figures and slides. GLE supports various graph types (function plots, histograms, bar graphs, scatter plots, contour lines, color maps, surface plots, ...) through a...
Platforms: Mac
| License: Freeware | Size: 6.07 MB | Download (47): GLE for Mac OS X Download |
Added: September 10, 2013 | Visits: 480
Plot Digitizer is a Java program used to digitize scanned plots of functional data. Often data is found presented in reports and references as functional X-Y type scatter or line plots. In order to use this data, it must somehow be digitized. This program will allow you to take a scanned image of...
Platforms: Mac
| License: Freeware | Size: 1.16 MB | Download (47): Plot Digitizer Download |
Added: July 16, 2013 | Visits: 512
(1) CubicBezier1.m : Evaluates Cubic Bezier Curve for given four Control Points and interval.(2) PlotBezier1.m : Plots Bezier Curve, Control Points, Control Polygon(3) TestCircleApproxByCubicBezier.m : Test Program. Pass Control Points that approximate unit radius circle using cubic Beizer...
Platforms: Matlab
| License: Freeware | Size: 122.88 KB | Download (47): Approximation of Circle Using Cubic Bezier Curve Download |
Added: March 23, 2013 | Visits: 441
PGPI(NUM,DEN,W,FI,A) plots the stability boundary locus L(KP,KI,W)in the (KP,KI)-plane for an LTI system with transfer function defined by its NUM, DEN coefficients and driven by a PI controller with transfer function, C(s)=kp+(ki/s). Frequency (W) gridding becomes important. Phase Margin, FI,...
Platforms: Matlab
| License: Freeware | Size: 10 KB | Download (47): PI Control with Gain and Phase Margin Specifications Download |
Added: March 30, 2013 | Visits: 442
Based on the Two line elements(TLE) - Input from the user, the program calculates the time and the date of the satellite pass. Prints out Azimuth and Elevation & plots it too.
Platforms: Matlab
| License: Freeware | Size: 153.6 KB | Download (47): GUI based Satellite Tracking System Download |
Added: May 06, 2013 | Visits: 531
Graphical user interface driven first-order multivariate calibration using up-to-date methods, including PCR, PLS, net analyte methods and ortoghonal signal correction. Provides a variety of pre-processing tools, cross-validation plots, prediction plots, elliptical joint region plots, net analyte...
Platforms: Matlab
| License: Freeware | Size: 532.48 KB | Download (47): First-order multivariate calibration Download |
Added: July 01, 2013 | Visits: 591
This GUI accepts the various constants needed to run a Black-Scholes calculation for pricing several European options:Put, Call, Straddle, Strangle, Bull Spread, Bear Spread, ButterflyIt plots the pricing surface for the appropriate option and then runs a number of Monte Carlo simulations (d
Platforms: Matlab
| License: Freeware | Size: 20.48 KB | Download (47): Simple option pricing GUI Download |
Added: May 01, 2013 | Visits: 357
Maple is a great tool for symbolic manipulation and is also very smart at plotting expressions, handling discontinuities,etc.However the plot customization and export possibilities are very primitive. Also, often I want to superimpose Maple plots with other data. This is very clumsy to handle in...
Platforms: Matlab
| License: Freeware | Size: 10 KB | Download (47): ReadMaplePlot Download |
Added: April 20, 2013 | Visits: 378
The toolbox converts 2D & 3D MATLAB plots to the METAPOST or Multi-METAPOST format. Files with Multi-METAPOST format can be advantageously used for creating of presentation in pdfLATEX by means of FoilTEX, PPower4 or beamer packages, etc.The toolbox can convert following graphic objects: axes,...
Platforms: Matlab
| License: Freeware | Size: 593.92 KB | Download (47): Multi-METAPOST Toolbox Download |
Added: April 25, 2013 | Visits: 459
JpGraph is a Object-Oriented Graph creating library for PHP >= 4.3.1. The library is completely written in PHP and ready to be used in any PHP scripts (both CGI/APXS/CLI versions of PHP are supported).The library can be used to create numerous types of graphs either on-line or written to a file....
Platforms: PHP
| License: Freeware | Size: 4.45 MB | Download (47): JPGraph for Scripts Download |
Added: October 18, 2013 | Visits: 538
The RLC Circuit with Function Generator model simulates a resistor, capacitor and inductor in series with either a sinusoidal or square wave voltage source and plots the time dependence of the voltage drops across each element. Users can vary the resistance, capacitance, inductance and source...
Platforms: Mac
| License: Freeware | Size: 2 MB | Download (47): RLC Circuit Model Download |
Added: April 29, 2013 | Visits: 654
This simple m-file plots the Soft Handover probability as a function of the Soft Handover Threshold value used in the UTRA Soft Handover Algorithm. The relationship has been dertived by taking the ratio between the Cell area where Soft Handovers are enabled and the total Cell area.
Platforms: Matlab
| License: Freeware | Size: 10 KB | Download (46): Soft Handover Probability as a function Download |
Added: May 11, 2013 | Visits: 655
The script shows two plots; the time response and the phase plane for different initial conditions depending on the coordinates of the mouse pointer.
Platforms: Matlab
| License: Freeware | Size: 102.4 KB | Download (46): ODE Phase Plane Download |