


Plots software
Plots
Released: August 25, 2015
|
Added: October 06, 2015 | Visits: 649
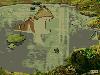 African plots screensaver will be loved by people who want to enjoy exotic countries and african safari. Every scene in the screensaver shows various moments of animals life. Proud lion rules other animals as king. You will find giraffes, elephants, rhinos, hippopotamus, snakes, turtle,...
Platforms: Windows, Windows 8, Windows 7, Windows Server
| License: Freeware | Size: 5.37 MB | Download (70): The African Plots Download |
Added: April 23, 2013 | Visits: 370
 printing plots with wide lines as png does not look pretty.These are the commands that I use now after some discussion at answers.see discussion at:http://www.mathworks.com/matlabcentral/ans...reat-linewidths
Platforms: Matlab
| License: Shareware | Cost: $0.00 USD | Size: 10 KB | Download (39): fixes to print HUGE plots as png Download |
Released: December 13, 2012
|
Added: December 13, 2012 | Visits: 641
 Install this screensaver on your PC and dive into the unique charm of Christmas and New Year holidays. You will find Christmas candles in the frame of the Christmas tinsel, gifts on the window, snowman, snow drifts, and the Christmas tree with toys. Christmas yard, pets, birds, enjoying the...
Platforms: Windows
| License: Freeware | Size: 4.13 MB | Download (51): Christmas Plots Download |
Added: April 29, 2013 | Visits: 513
[h,varargout]=plotColumns(data,varargin)plots columns of a matrix as if each column is a time seriesUSAGE:plotColumns(data);[h] = plotColumns(t,data);[h] = plotColumns(t,data,{colors});[h] = plotColumns(t,data,'plotopt');[h] = plotColumns(...,'plotopt');[h] = plotColumns(...,{colors});
Platforms: Matlab
| License: Freeware | Size: 10 KB | Download (41): plotColumns.m: plots columns in matrix as time series Download |
Added: August 05, 2013 | Visits: 496
function [f,a] = iqtofreqplot(x,freq)Finds the angle and frequency of IQs it then plots the angle and frequency as a function of time IQTOFREQPLOT('complex data', 'rate at which received I and Q per second')if you choose not to put in a frequency rate use IQTOFREQPLOT('IQ')please note that the...
Platforms: Matlab
| License: Freeware | Size: 10 KB | Download (42): Angle and Frequency plots of IQs Download |
Added: April 10, 2013 | Visits: 229
This program is a GUI that takes as input a transfer function. It decomposes the function into poles, zeros, constants,... and plots the asymptotic approximation of each. Individual terms can be added or deleted from the plot.Full Description...
Platforms: Matlab
| License: Shareware | Cost: $0.00 USD | Size: 30.72 KB | Download (38): GUI for Asymptotic Bode Plots Download |
Added: April 11, 2013 | Visits: 317
Whilst box plots have their place, it's sometimes nicer to see all the data making up a distribution rather than hiding them with summary statistics such as the inter-quartile range. This function (with a tongue in cheek name) addresses this problem. To the best of my knowledge there aren't...
Platforms: Matlab
| License: Shareware | Cost: $0.00 USD | Size: 10 KB | Download (39): notBoxPlot - alternative to box plots. Download |
Added: August 26, 2013 | Visits: 365
Quickly and easily create 2d and 3d plots of fMRI data.Industry standard brain plotting programs are great for producing publication-quality images of brain data. However, these tools are often very slow. This suite of tools provides a means of quickly generating 2- or 3-dimensional plots of fMRI...
Platforms: Matlab
| License: Shareware | Cost: $0.00 USD | Size: 10 KB | Download (42): 2d and 3d brain plots Download |
Added: June 03, 2013 | Visits: 358
This zip files contains programs (five functions, one example program, and one sample data set) to plot data in ternary diagrams. The first option is a pseudo color plot, the second is a contour plot, and the third style plots the data as color coded symbols (similar to my function 'plot3c'). An...
Platforms: Matlab
| License: Shareware | Cost: $0.00 USD | Size: 20.48 KB | Download (40): Ternary Plots Download |
Added: September 12, 2013 | Visits: 461
This function adds a grid to 2D plots. The grid contains out of lines which can be modified by linestyles and color information. This function expands the functionality of the normal grid implemented in MATLAB plots.plot(rand(1,10));set(gcf,'color',[1 1 1]);grid2(gca,'color',[0.7 0.7...
Platforms: Matlab
| License: Shareware | Cost: $0.00 USD | Size: 10 KB | Download (42): grid2 - add a grid to 2D plots Download |
Added: May 21, 2013 | Visits: 389
I often have an array of data which I would like to browse through. This is a simple GUI which takes in data, the number of plots, and a handle to a plotting function. The scroll bar will then allow you to scroll through each plot. The plot function takes in as arguments the data, the index of...
Platforms: PHP
| License: Shareware | Cost: $0.00 USD | Size: 10 KB | Download (45): Browse Plots Download |
Added: January 18, 2010 | Visits: 1.200
PLplot is a library of functions that are useful for making scientific plots. PLplot can be used from within compiled languages such as C, C++, FORTRAN and Java, and interactively from interpreted languages such as Octave, Python, Perl and Tcl. The PLplot library can be used to create standard...
Platforms: *nix
| License: Freeware | Size: 6.1 MB | Download (90): PLplot Download |
Added: May 21, 2010 | Visits: 884
DISLIN is a high-level plotting library for displaying data as curves, polar plots, bar graphs, pie charts, 3D-color plots, surfaces, contours and maps. DISLIN is intended to be a powerful and easy to use software package for scientists and programmers. There are only a few graphics routines...
Platforms: *nix
| License: Shareware | Cost: $0.00 USD | Size: 8.9 MB | Download (128): DISLIN Download |
Added: January 18, 2010 | Visits: 761
MoioChart project is my Java library to draw function plots, bar graphs, pie graphs, etc. Why should I use it? Firstly, because it is very easy to use. For example: Drawable objects such as functions, axes, pies, etc. can be added to or removed from the Chart via the standard Collection...
Platforms: *nix
| License: Freeware | Size: 307.2 KB | Download (92): MoioChart Download |
Added: May 10, 2013 | Visits: 703
Biggles is a Python module that allows you to publish 2D scientific plots. Its features includ a high-level interface, a simple TeX interpreter, and multiple image output formats. Requirements: - libplot.dll (tested version from plotutils-2.4.1-1-bin.zip) - libpng.dll (tested version from...
Platforms: Windows, *nix, Python, BSD
| License: Freeware | Download (59): Biggles Download |
Added: April 29, 2013 | Visits: 645
This simple m-file plots the Soft Handover probability as a function of the Soft Handover Threshold value used in the UTRA Soft Handover Algorithm. The relationship has been dertived by taking the ratio between the Cell area where Soft Handovers are enabled and the total Cell area.
Platforms: Matlab
| License: Freeware | Size: 10 KB | Download (46): Soft Handover Probability as a function Download |
Added: August 26, 2013 | Visits: 360
it finds the shortest path from the given network having given no of links between given no of nodes and plots the given network as well as the modified network having shortest path in terms of cost
Platforms: Matlab
| License: Freeware | Size: 10 KB | Download (41): dijkstra algorithm Download |
Added: September 17, 2013 | Visits: 923
This m-file finds and plots the autocorrelation and crosscorrelation function(ACF and CCF) of generated Gold codes of length 31.Crosscorrelations are three valued.
Platforms: Matlab
| License: Freeware | Size: 10 KB | Download (53): Autocorrelation and Crosscorrelation function of gold sequence Download |
Added: September 11, 2013 | Visits: 564
Derives the transfer function for digital implementation of a first order RC low pass filter and plots the step and frequency response.For details, refer to the post:http://www.dsplog.com/2007/12/02/digital-i...ow-pass-filter/
Platforms: Matlab
| License: Freeware | Size: 10 KB | Download (49): Digital implementation of RC low pass filter Download |
Added: June 13, 2013 | Visits: 371
Plots columns of matrix data as distinct time series. User should normalize data first to minimize overlap.
Platforms: Matlab
| License: Freeware | Size: 10 KB | Download (40): plotXmatrix.m Download |