


Plots freeware
Plots
Added: March 28, 2013 | Visits: 472
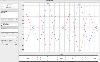
 This code finds and plots the Pareto front of the following problem:Find the smallest circle to enclose the largest no. of stars in a the following* space of stars.*a space filled with a randomly positioned stars, so you will not get the same results for two different runs
Platforms: Matlab
This code finds and plots the Pareto front of the following problem:Find the smallest circle to enclose the largest no. of stars in a the following* space of stars.*a space filled with a randomly positioned stars, so you will not get the same results for two different runs
Platforms: Matlab
| License: Freeware | Size: 20.48 KB | Download (46): Pareto Front Using Fitness Sharing Download |
Released: December 10, 2012
|
Added: December 10, 2012 | Visits: 518
APLpy (the Astronomical Plotting Library in Python) is a Python module aimed at producing publication-quality plots of astronomical imaging data in FITS format. Visit http://aplpy.sourceforge.net/ for tutorials and documentation.
Platforms: Mac, Linux
| License: Freeware | Size: 55.36 KB | Download (46): APLpy (Astronomical Plotting in Python) Download |
Released: June 21, 2012
|
Added: June 21, 2012 | Visits: 377
 Creates interactive plots of data lines over a time scale. Automatic detection of input format and scale will result in instantaneous results without any need for configuration.
Platforms: Windows, Mac, Linux
Creates interactive plots of data lines over a time scale. Automatic detection of input format and scale will result in instantaneous results without any need for configuration.
Platforms: Windows, Mac, Linux
| License: Freeware | Size: 21.33 KB | Download (46): Time Data Plotter Download |
Released: November 04, 2012
|
Added: November 04, 2012 | Visits: 382
 ClickPlot is a data viewer app designed to make viewing and navigating plots of your data files so easy and intuitive you'll quickly learn far more about your data than you ever thought possible!
Revolutionary Features
• File format is au
Platforms: Mac
ClickPlot is a data viewer app designed to make viewing and navigating plots of your data files so easy and intuitive you'll quickly learn far more about your data than you ever thought possible!
Revolutionary Features
• File format is au
Platforms: Mac
| License: Freeware | Size: 3.5 MB | Download (46): ClickPlot Download |
Added: August 16, 2013 | Visits: 485
The Hardy Weinberg equilibrium is a fundamental law in genetic.This function was deeply rewrited.If a locus is biallelic the function use the exact Hardy Weinberg test (similar to Fisher exact test) analyzing all possible tables. If you download TERNPLOT functions (ID:2299) the function plots a...
Platforms: Matlab
| License: Freeware | Size: 10 KB | Download (46): HWtest Download |
Added: July 08, 2013 | Visits: 572
This Program Performs the following:(1) Animates the movement of a Billiard Ball on a table that has a surface friction (mu) and coefficient of restitution (e) for the sides and saves it as an AVI file.(2) Outputs series of rows and columns that displays the stream data of (Time),(X),(Y),(V), and...
Platforms: Matlab
| License: Freeware | Size: 133.12 KB | Download (46): Billiard Ball Animation Download |
Added: May 27, 2013 | Visits: 487
GaAs-GaAlAs Quantum WellIn a type I quantum well, the energy difference d?OCLEg between the larger band gap of the barrier and the smaller band gap of the well material causes a confinement potential both for the electrons in the conduction band and for the holes in the valence band. In a...
Platforms: Matlab
| License: Freeware | Size: 10 KB | Download (46): GaAs GaAlAs Quantum Wells Download |
Added: July 04, 2013 | Visits: 353
A simple Cocoa view framework for creating real-time and static plots and graphs. Using SimplePlot is easy. Add the source to your project, treat any of the graphs or plots as if they were native Cocoa controls. SimplePlots work like tableViews in that they implement the DataSource pattern....
Platforms: Mac
| License: Freeware | Size: 2.6 MB | Download (46): SimplePlot Download |
Added: April 02, 2013 | Visits: 401
Normally boxplot plots the whiskers with a maximum length based on the distance between the 25th and 75th percentile. This script uses boxplot but plots the whiskers for a specified percentile and only plots the outliers beyond the new whiskers.Note that the percentile is defined as the data...
Platforms: Matlab
| License: Freeware | Size: 10 KB | Download (45): Box Plot with Whiskers Plotted at Fixed Percentiles Download |
Added: May 14, 2013 | Visits: 449
The program uses simulink to compute the reaction paths in three-species reaction mixture and plots these paths in an equilateral graph. This problem was first treated by Wei and Prater. Applications of this problem include butene isomerization.
Platforms: Matlab
| License: Freeware | Size: 40.96 KB | Download (45): Wei-Prater Mechanism Download |
Added: September 13, 2013 | Visits: 389
Different elevations cannot be identified with standard matlab functions such as surf, even changing FaceColor attribute to activate interpolation. In contrast, with this function alows one can define contour levels and different colors are applied to each level.Instead of using surf(x,y,z), you...
Platforms: Matlab
| License: Freeware | Size: 10 KB | Download (45): Plots a surface coloring by layers (using contour curves) Download |
Added: August 19, 2013 | Visits: 468
[coef, RSquared]=plotfit(x,y,polyorder)A simple function that accepts x,y data pairs in in the vectors "x" and "y", fits it to a polynomial of order "polyorder", plots the data and the fit, and displays the fit coefficients and the goodness-of-fit measure R-squared in the upper left corner of the...
Platforms: Matlab
| License: Freeware | Size: 10 KB | Download (45): plotfit Download |
Added: July 06, 2013 | Visits: 378
The signals presented here can be used in demonstrating how the signal varies when the operation is made on either independent variable or dependent variable. The parameters can be varied to have a feel of the variation.Example(1): rect(1,2) plots the rectangular signal of amplitude 1 and a width...
Platforms: Matlab
| License: Freeware | Size: 10 KB | Download (45): elementary signals Download |
Added: May 12, 2013 | Visits: 387
Raw MRI data are generated analytically from k-space coordinates using the (continuous) Shepp and Logan head phantom function. K -space coordinates are typically entered as 2D matrices (frequency and phase encodes).This tool is ideal for testing reconstruction of non-linear k-space trajectory MRI...
Platforms: Matlab
| License: Freeware | Size: 10 KB | Download (45): mriphantom Download |
Added: June 02, 2013 | Visits: 437
In semiconductors, it is possible to make actual potential wells by sandwiching a d-deDUwelld-deDt layer of one semiconductor material (such as InGaAs) between two d-deDUbarrierd-deDt layers of another semiconductor material (such as InP). In this structure, the electron has lower energy in the...
Platforms: Matlab
| License: Freeware | Size: 30.72 KB | Download (45): GaAs Single Quantum Well Download |
Added: March 24, 2013 | Visits: 532
PID control over the exit raffinate composition (x5) of a five stages column is obtained by changing solvent flow rate (G). The set point is equal to 0.1. The model equations include backmixing effects. This problem is solved using Berkeley-Madonna in Chemical Engineering Dynamics, Ingham et al.,...
Platforms: Matlab
| License: Freeware | Size: 30.72 KB | Download (45): A Five Stage Extraction Cascade with Backmixing and Control Download |
Added: April 03, 2013 | Visits: 404
This function plots sand, silt and clay fraction data on a ternary plot that is marked with the Shepard classification scheme labels from his article:Shepard, F.P., 1954, Nomenclature based on sand-silt-clay ratios: Journal Sedimentary Petrology, v. 24, p. 151-158.This function is merely a...
Platforms: Matlab
| License: Freeware | Size: 10 KB | Download (45): Shepard_Ternary_Plot Download |
Added: July 21, 2013 | Visits: 383
Plots triples ( t, real(z(t)), imag(z(t)) ), a shiskebob of complex numbers. For visual context, each complex number is a dot on its own gray constant-amplitude envelope circle with a blue radius from the center axis.
Platforms: Matlab
| License: Freeware | Size: 10 KB | Download (44): plot_cc Download |
Added: April 07, 2013 | Visits: 745
This simple m-file plots the Soft Handover probability as a function of the Soft Handover Threshold value used in the UTRA Soft Handover Algorithm. The relationship has been dertived by taking the ratio between the Cell area where Soft Handovers are enabled and the total Cell area.
Platforms: Matlab
| License: Freeware | Size: 10 KB | Download (44): Soft Handover Probability as a funiction of the Soft Handover Threshold Download |
Added: March 23, 2013 | Visits: 228
Calculates and plots regression statistics from lsqcurvefit.m in MATLAB rel 13
Platforms: Matlab
| License: Freeware | Size: 10 KB | Download (44): regdata Download |