


Box Plot Graph software
Box Plot Graph
Released: August 22, 2012
|
Added: August 22, 2012 | Visits: 428
 MathGV application was designed to be a mathematical function graphing software.
The MathGV interface is dialogue driven and allows changes to any setting at any time with immediate results. This instant visual feedback makes mathematical functions much easier to understand.
MathGV application was designed to be a mathematical function graphing software.
The MathGV interface is dialogue driven and allows changes to any setting at any time with immediate results. This instant visual feedback makes mathematical functions much easier to understand.
Platforms: Windows, 2003, Windows Vista, 7
| License: Freeware | Download (440): MathGV Download |
Released: July 16, 2012
|
Added: July 16, 2012 | Visits: 477
OxyPlot is a .NET library designed for plotting applications. It was created with focus on simplicity and performance.
The library contains custom controls for WPF, Silverlight and Windows Forms and includes exporters for SVG, PDF, XPS and PNG.
Platforms: Windows
| License: Freeware | Download (44): OxyPlot Download |
Released: November 13, 2012
|
Added: November 13, 2012 | Visits: 961
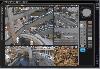 CyeWeb is a hybrid IP/CCTV video surveillance program supporting IP camera (Axis, Panasonic, HikVision, AVTech), capture/compression card, USB-webcam and network streams, etc. It has network functions such as e-mail notification, build-in Web server, streaming server, MMS Broadcast and remote...
Platforms: Windows
| License: Shareware | Cost: $75.95 USD | Size: 26.82 MB | Download (55): CyeWeb Download |
Released: December 24, 2012
|
Added: December 24, 2012 | Visits: 558
 MIX Pro is a straight forward application that enables users to create and edit their own data sets in the easy spreadsheet interface of Excel. The available feature set is very comprehensive and conveniently categorized in exploration, synthesis, and evaluation procedures.
Numerical features...
MIX Pro is a straight forward application that enables users to create and edit their own data sets in the easy spreadsheet interface of Excel. The available feature set is very comprehensive and conveniently categorized in exploration, synthesis, and evaluation procedures.
Numerical features...
Platforms: Windows
| License: Commercial | Cost: $210.00 USD | Size: 2.5 MB | Download (590): MIX Pro Download |
Added: May 23, 2013 | Visits: 310
PLOTSTATS(XDATA,YDATA) generate a nice figure for the statistical visualisation of datasets. YDATA is a cell array of vectors, each vector being a group of samples to test. XDATA is a cell array of the same size of YDATA, each element being a single number representing the abscissa of the...
Platforms: Matlab
| License: Shareware | Cost: $0.00 USD | Size: 10 KB | Download (47): plotstats Download |
Added: June 20, 2013 | Visits: 330
Simulator of vibrating string with possibility to set different parameters include initial positions, velocities, distributed friction. Solved as 1d wave equation with friction with FDM method. It is possible to plot graph, spectrogram, animated graph, listen stereo sound and realtime. Move...
Platforms: Matlab
| License: Shareware | Cost: $0.00 USD | Size: 71.68 KB | Download (39): vibrating string simulator Download |
Added: September 16, 2013 | Visits: 397
Fragmentation Analyzer is a tool for analyzing MS/MS fragmentation data. Currently nine different analysis types are supported: * Spectra Visualization - visualize the MS/MS spectra with fragment ion annotation, zooming and manual de-novo-sequencing. * Intensity Box Plots - analyze intensity...
Platforms: Mac
| License: Freeware | Size: 15.27 MB | Download (34): Fragmentation Analyzer Download |
Released: August 07, 2019
|
Added: September 02, 2019 | Visits: 75.591
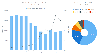 AnyChart is a robust and superfast JavaScript charting library to add great-looking, interactive HTML5 charts into any project, in any browser, and on any platform/OS including mobile ones.
AnyChart provides advanced customization and flexibility opportunities, no matter if you are developing...
AnyChart is a robust and superfast JavaScript charting library to add great-looking, interactive HTML5 charts into any project, in any browser, and on any platform/OS including mobile ones.
AnyChart provides advanced customization and flexibility opportunities, no matter if you are developing...
Platforms: Windows, Mac, *nix, Windows 8, Windows 7, Windows Server, iOS, Android, iPhone,iPad
| License: Shareware | Cost: $49.00 USD | Size: 17.81 MB | Download (1228): AnyChart JS Charts and Dashboards Download |
Added: October 14, 2010 | Visits: 1.652
GD::Graph is a graph plotting module for Perl 5. SYNOPSIS use GD::Graph::moduleName; GD::Graph is a perl5 module to create charts using the GD module. The following classes for graphs with axes are defined: GD::Graph::lines Create a line chart. GD::Graph::bars and GD::Graph::hbars...
Platforms: *nix
| License: Freeware | Size: 143.36 KB | Download (111): GD::Graph Download |
Released: August 09, 2002
|
Added: October 17, 2006 | Visits: 5.455
Master Graph is easy-to-use graphing, curve fitting software.
Support three types of graphs (Cartesian, polar and parametric functions).
Complete tuning of appearance of the graphs and coordinate system (various
colours, styles of lines and points). Support the Office XP style for toolbars...
Platforms: Windows
| License: Shareware | Cost: $20.00 USD | Size: 604 KB | Download (351): AMaster Graph Download |
Added: November 22, 2006 | Visits: 4.579
 Rt-Plot is a tool to generate Cartesian X/Y-plots from scientific data. You can enter and calculate tabular data. View the changing graphs, including linear and non linear regression, interpolation, differentiation and integration, during entering. Rt-Plot enables you to create plots fast and...
Platforms: Windows
| License: Shareware | Cost: $50.00 USD | Size: 5.56 MB | Download (195): Rt-Plot Download |
Released: June 06, 2004
|
Added: January 24, 2006 | Visits: 3.187
 The "xyExtract" software is used for to extract data from a 2D graph (orthogonal and nonorthogonal axes) contained in a graphic file (scanned, PDF document or in a some file like gif, jpg, etc). The graphic file must be saved in a bitmap file. Then, the "xyExtract" converts the graph back to xy...
| License: Shareware | Cost: $25.00 USD | Size: 450 KB | Download (771): xyExtract Graph Digitizer Download |
Added: August 22, 2008 | Visits: 1.421
Graph Plotter is a powerful tool which can help you to plot and analyze different types of graphs. It is easy-to-use and user-friendly. In addition it can find asymptotes of function, break points, extremums and calculate limit, define integral, derivative of function and more.
Platforms: Windows
| License: Shareware | Cost: $25.00 USD | Size: 1.69 MB | Download (158): Graph Plotter Download |
Added: January 18, 2010 | Visits: 2.264
Chart::Graph::Gnuplot is a function in module Chart::Graph that lets you generate graphs on the fly in perl. SYNOPSIS use Chart::Graph::Gnuplot qw(&gnuplot); gnuplot(%global_options, [%data_set_options, @matrix], [%data_set_options, @x_column, @y_column], [%data_set_options, < filename...
Platforms: *nix
| License: Freeware | Size: 8.19 KB | Download (167): Chart::Graph::Gnuplot Download |
Added: September 03, 2010 | Visits: 2.138
SVG::Graph is a Perl module to visualize your data in Scalable Vector Graphics (SVG) format. SYNOPSIS use SVG::Graph; use SVG::Graph::Data; use SVG::Graph::Data::Datum; #create a new SVG document to plot in... my $graph = SVG::Graph->new(width=>600,height=>600,margin=>30); #and create...
Platforms: *nix
| License: Freeware | Size: 88.06 KB | Download (151): SVG::Graph Download |
Added: January 09, 2010 | Visits: 2.547
Chart::Plot::Canvas is a Perl module to plot two dimensional data in an Tk Canvas. SYNOPSIS use Chart::Plot::Canvas; my $img = Chart::Plot::Canvas->new(); my $anotherImg = Chart::Plot::Canvas->new ($image_width, $image_height); $img->setData (@dataset) or die( $img->error() );...
Platforms: *nix
| License: Freeware | Size: 5.12 KB | Download (162): Chart::Plot::Canvas Download |
Added: April 19, 2010 | Visits: 1.244
SVG::Template::Graph is a Perl extension for generating template-driven graphs with SVG. SYNOPSIS use SVG::Template::Graph; $data = [ { barGraph=>1,# barSpace=>20, title=> 1: Trace 1, data => #hash ref containing x-val and y-val array refs { x_val => [50,100,150,200,250,...
Platforms: *nix
| License: Freeware | Download (99): SVG::Template::Graph Download |
Added: January 22, 2010 | Visits: 1.649
Chart::Plot is a Perl module to plot two dimensional data in an image. SYNOPSIS use Chart::Plot; my $img = Chart::Plot->new(); my $anotherImg = Chart::Plot->new ($image_width, $image_height); $img->setData (@dataset) or die( $img->error() ); $img->setData (@xdataset, @ydataset);...
Platforms: *nix
| License: Freeware | Size: 15.36 KB | Download (116): Chart::Plot Download |
Added: August 18, 2010 | Visits: 1.021
B::Graph is a Perl compiler backend to produce graphs of OP trees. SYNOPSIS perl -MO=Graph,-text prog.pl >graph.txt perl -MO=Graph,-vcg prog.pl >graph.vcg xvcg graph.vcg perl -MO=Graph,-dot prog.pl | dot -Tps >graph.ps This module is a backend to the perl compiler (B::*) which, instead...
Platforms: *nix
| License: Freeware | Size: 12.29 KB | Download (90): B::Graph Download |
Added: May 10, 2013 | Visits: 558
This vertical bar graph is done completely using DHTML and CSS. Unlike an applet based solution, this loads fast and blends in with the rest of the page. You can even use a transparent background for it.
Platforms: Windows, Mac, *nix, JavaScript, BSD Solaris
| License: Freeware | Download (58): DHTML / CSS based bar graph Download |