


Box Plot Graph software
Box Plot Graph
Added: April 02, 2013 | Visits: 398
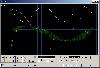
 Normally boxplot plots the whiskers with a maximum length based on the distance between the 25th and 75th percentile. This script uses boxplot but plots the whiskers for a specified percentile and only plots the outliers beyond the new whiskers.Note that the percentile is defined as the data...
Platforms: Matlab
| License: Freeware | Size: 10 KB | Download (45): Box Plot with Whiskers Plotted at Fixed Percentiles Download |
Added: June 20, 2013 | Visits: 314
Displays stacked box plots and optionally prints a label next to each box plot. The box plots show the first, second and third quartiles. The whiskers extend to the the smallest and largest data that are in range of 1.5x IQR of the first and third quartile,...
Platforms: Matlab
| License: Shareware | Cost: $0.00 USD | Size: 10 KB | Download (43): boxplotstack Download |
Added: August 22, 2013 | Visits: 306
This simple function allows you to create individual boxes in a box plot. The boxes do not have to be based on the same sample size, and to emphasize this fact the sample size n is displayed in the box's tick label. Outliers are identified in the plot by their indices. The function can also...
Platforms: Matlab
| License: Shareware | Cost: $0.00 USD | Size: 10 KB | Download (43): singlebox Download |
Released: September 20, 2006
|
Added: March 15, 2007 | Visits: 4.065
 ActiveX Automation HMI Instrument Input Components including different kinds of 3D buttons, switches, knobs, sliders, switchsliders, switchknobs and others can be widely applied in many industry HMI applications and Simulation environments. The SmartButton ActiveX control is designed to enhance...
Platforms: Windows
| License: Demo | Cost: $150.00 USD | Size: 7 B | Download (187): Instrumentation Graph Extension ActiveX Components Download |
Released: September 12, 2012
|
Added: September 12, 2012 | Visits: 706
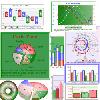
DataScene Professional is a scientific application that helps you design graphs and graph animation. It is also capable to perform data analysis, curve fitting, and data monitoring.
It allows the user to easily plot 2D & 3D graphs (Area, Bar, Pie, Line, Surface, Ploar, and more), to manipulate,...
Platforms: Windows
| License: Freeware | Download (459): DataScene Professional Download |
Added: June 17, 2013 | Visits: 315
Give a dot plot for one data group. It could rerun the function by changing the 'data' and 'groupNum' for multi-group. It should run the function one times for each group, and they will show in the same diagram. The dot plot could also combine with box plot. Syntax dotPlot_xtr( data )...
Platforms: Matlab
| License: Shareware | Cost: $0.00 USD | Size: 10 KB | Download (43): Dot plot rather than scatter plot Download |
Released: October 06, 2012
|
Added: October 06, 2012 | Visits: 388
 DataScene is a data graphing, animation, and analysis software package. It allows the user to easily plot 2D & 3D graphs (Area, Bar, Pie, Line, Surface, Ploar, and more) with scientific, financial, and statistical data, to manipulate, print, and export high quality graphs.
DataScene can also...
DataScene is a data graphing, animation, and analysis software package. It allows the user to easily plot 2D & 3D graphs (Area, Bar, Pie, Line, Surface, Ploar, and more) with scientific, financial, and statistical data, to manipulate, print, and export high quality graphs.
DataScene can also...
Platforms: Windows
| License: Shareware | Cost: $219.00 USD | Size: 46.6 MB | Download (452): DataScene Deluxe Download |
Released: July 07, 2012
|
Added: July 07, 2012 | Visits: 918
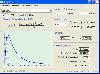
 Universal oscilloscope GUI ( Real-time plot ) DLL library for data acquisition, simulation, debugging.Advantages:1.Speedy performance: the library makes it possible to bring out into the beams of the viewing oscilloscope over a million quantization steps of signal per second (on the Pentium III...
Platforms: Windows, Windows Vista
| License: Freeware | Size: 3.54 MB | Download (127): Universal Software Oscilloscope Library Download |
Added: May 10, 2013 | Visits: 756
This open source, digitizing software converts an image file showing a graph or map, into numbers. The image file can come from a scanner, digital camera or screenshot. The numbers can be read on the screen, and written or copied to a spreadsheet. The process starts with an image file containing...
Platforms: Windows, Mac, *nix, C/C++, BSD
| License: Freeware | Download (60): Engauge Digitizer Download |
Released: December 31, 2007
|
Added: January 01, 2008 | Visits: 3.088
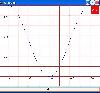
 SpeQ is a small, extensive mathematics program with a simple, intuitive interface. All calculations are entered in a sheet. In there you can freely add, edit and execute all calculations. You can define variables and functions, and plot graphs of your functions. You can save your calculations for...
Platforms: Windows
| License: Freeware | Size: 497.77 KB | Download (293): SpeQ Mathematics Download |
Released: January 01, 2013
|
Added: February 16, 2014 | Visits: 915
 It is one of the most powerful math tools there is. It gathers between the simplicity and ease of use of a simple calculator and the ability to solve complex math procedures.
Here is a brief description of the exciting capabilities of mathwizard:
1. Matrices :
>For real and complex...
It is one of the most powerful math tools there is. It gathers between the simplicity and ease of use of a simple calculator and the ability to solve complex math procedures.
Here is a brief description of the exciting capabilities of mathwizard:
1. Matrices :
>For real and complex...
Platforms: Windows, Windows 7, Windows Server
| License: Shareware | Cost: $9.99 USD | Size: 539.06 KB | Download (122): Mathwizard Download |
Added: May 10, 2013 | Visits: 668
Graphist presents plots of data as GIF, JPEG, or PNG images. Though PHP is used by Graphist to produce the image, pages that use its images can be ordinary HTML. These images are added to a web page the same way as any image, such as a corporate logo or picture of your dog: an IMG tag. The tag's...
Platforms: Windows, Mac, *nix, PHP, BSD Solaris
| License: Freeware | Download (69): Graphist Download |
Added: August 30, 2013 | Visits: 302
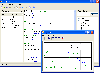
FastFillGrid populates a grid, i.e. Microsoft Spreadsheet Object, with a cell arrayThanks Brett Shoelson, via CSSMPUTCELLVALUE puts a value in an active cellfastfillgrid is both a directory and a function.FastFillGrid populates a grid, i.e. Microsoft Spreadsheet Object, with a cell arrayThe cell...
Platforms: Matlab
| License: Shareware | Cost: $0.00 USD | Size: 51.2 KB | Download (48): FastFillGrid Download |
Added: January 04, 2006 | Visits: 2.431
 Math software is often bulky, overloaded with useless features and requires reading huge manual before attempting to use it. SLGallery is the unique probability distribution calculation toolbox featuring 11 continuous and 4 discrete functions. With SLGallery it is possible to plot graph and find...
Platforms: Windows
| License: Freeware | Size: 489 KB | Download (252): SLGallery Download |
Released: September 20, 2006
|
Added: March 14, 2007 | Visits: 5.103
 ActiveX components provide you reusabe, flexible, reliable, robust and stable software UI(User Interface) solution. Of course, if you have any development environment which supports ActiveX or OLE design (i.e., Visual Basic, Visual C++, C#, VBA, C++ Builder, Delphi and so on), you can apply all...
Platforms: Windows
| License: Demo | Cost: $380.00 USD | Size: 7 B | Download (280): Graphic-Chart ActiveX Components Download |
Released: March 05, 2007
|
Added: March 15, 2007 | Visits: 4.067
 Welcome to Dragonfly Chart .Net for Windows Form Version 2.0.0.0, including more than 7 chart components of Pie Chart, Bar Chart, X-Y Chart and Angular Chart.
Dragonfly Chart .Net provides 2D/ 3D .Net Controls of pie chart, ring chart, bar chart, X-Y Chart and angle chart, which can be widely...
Welcome to Dragonfly Chart .Net for Windows Form Version 2.0.0.0, including more than 7 chart components of Pie Chart, Bar Chart, X-Y Chart and Angular Chart.
Dragonfly Chart .Net provides 2D/ 3D .Net Controls of pie chart, ring chart, bar chart, X-Y Chart and angle chart, which can be widely...
Platforms: Windows
| License: Demo | Cost: $300.00 USD | Size: 3 B | Download (566): Dragonfly Chart .Net Download |
Added: October 23, 2010 | Visits: 2.092
Bio::Tools::Run::PiseApplication::charge is a Perl module. Bio::Tools::Run::PiseApplication::charge Bioperl class for: CHARGE Protein charge plot (EMBOSS) Parameters: (see also: http://bioweb.pasteur.fr/seqanal/interfaces/charge.html for available values): charge (String) init...
Platforms: *nix
| License: Freeware | Size: 829.44 KB | Download (101): Bio::Tools::Run::PiseApplication::charge Download |
Added: November 23, 2010 | Visits: 1.182
Bio::Tools::Run::PiseApplication::freak is a Perl module. Bio::Tools::Run::PiseApplication::freak Bioperl class for: FREAK Residue/base frequency table or plot (EMBOSS) Parameters: (see also: http://bioweb.pasteur.fr/seqanal/interfaces/freak.html for available values): freak...
Platforms: *nix
| License: Freeware | Size: 829.44 KB | Download (94): Bio::Tools::Run::PiseApplication::freak Download |
Added: January 25, 2010 | Visits: 595
GLMStat fits generalized linear models and basic statistics. Models include linear, logistic and contingency tables. Graphs are scatter, box plot, and frequency distribution.
Platforms: Mac
| License: Shareware | Cost: $0.00 USD | Download (115): GLMStat Download |
Added: January 25, 2010 | Visits: 648
GLMStat fits generalized linear models and basic statistics. Models include linear, logistic and contingency tables. Graphs are scatter, box plot, and frequency distribution.
Platforms: Mac
| License: Shareware | Cost: $0.00 USD | Download (107): GLMStat X Download |