


Sigma Plot freeware
Sigma Plot
Released: July 07, 2012
|
Added: July 07, 2012 | Visits: 921
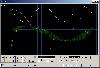 Universal oscilloscope GUI ( Real-time plot ) DLL library for data acquisition, simulation, debugging.Advantages:1.Speedy performance: the library makes it possible to bring out into the beams of the viewing oscilloscope over a million quantization steps of signal per second (on the Pentium III...
Platforms: Windows, Windows Vista
Universal oscilloscope GUI ( Real-time plot ) DLL library for data acquisition, simulation, debugging.Advantages:1.Speedy performance: the library makes it possible to bring out into the beams of the viewing oscilloscope over a million quantization steps of signal per second (on the Pentium III...
Platforms: Windows, Windows Vista
| License: Freeware | Size: 3.54 MB | Download (127): Universal Software Oscilloscope Library Download |
Released: June 13, 2012
|
Added: June 13, 2012 | Visits: 452
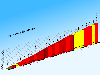 CycloGraph is a handy program to help you plot the gradient of roads using distances and heights. An Open Source alternative to Salitaker for plotting the profile of the roads you are planning to do with your bicycle. It also can import routes from kml. FEATURES: · import kml files · open...
Platforms: Windows
CycloGraph is a handy program to help you plot the gradient of roads using distances and heights. An Open Source alternative to Salitaker for plotting the profile of the roads you are planning to do with your bicycle. It also can import routes from kml. FEATURES: · import kml files · open...
Platforms: Windows
| License: Freeware | Size: 16.2 MB | Download (504): CycloGraph Download |
Released: November 19, 2012
|
Added: November 19, 2012 | Visits: 348
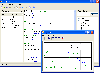
 The Plot.py project tries to supply an easy to use measurement data visualization and treatment framework being easy to use while keeping the freedom for advanced users to execute additional data treatment algorithms. The program is build on a object oriented modular basis to provide the...
Platforms: Linux
The Plot.py project tries to supply an easy to use measurement data visualization and treatment framework being easy to use while keeping the freedom for advanced users to execute additional data treatment algorithms. The program is build on a object oriented modular basis to provide the...
Platforms: Linux
| License: Freeware | Size: 850 KB | Download (485): Plotting GUI for Linux 0.7.13 Beta Download |
Added: May 10, 2013 | Visits: 543
 In SIMULINK-model of a Delta-Sigma ADC, we have a non-ideal multibit DAC in the feedback loop. The DAC mismatch noise will be shaped according to a general Data Weighted Averaging (DWA) transfer function 1±z^(-D), where D is a positive integer (delay). The DWA element selection...
Platforms: Windows, Mac, *nix, Matlab, Solaris
In SIMULINK-model of a Delta-Sigma ADC, we have a non-ideal multibit DAC in the feedback loop. The DAC mismatch noise will be shaped according to a general Data Weighted Averaging (DWA) transfer function 1±z^(-D), where D is a positive integer (delay). The DWA element selection...
Platforms: Windows, Mac, *nix, Matlab, Solaris
| License: Freeware | Download (61): Data Weighted Averaging for Simulink Download |
Added: May 10, 2013 | Visits: 488
Because MATLAB doesn't provide a built-in function to plot bars with any error adjustments, this script will draw vertical bars and display an error marker for each bar.For an advanced user, this function also provides ways to modify any and all of the bar and line series properties while...
Platforms: Windows, Mac, *nix, Matlab, BSD Solaris
| License: Freeware | Download (55): Bar with errorbars Download |
Added: May 10, 2013 | Visits: 366
It can be used to plot only discrete data, not having support for mathematical functions. Limitations: - Does not support functions. - Don't suit all applciations.
Platforms: Windows, Mac, *nix, Python, BSD Solaris
| License: Freeware | Download (54): Graphication Download |
Added: March 24, 2013 | Visits: 426
For a full description of the models, refer to the September 2007 MATLAB Digest article.http://www.mathworks.com/company/newslette...sigmadelta.htmlWe present a series of Simulink models to design a high-level behavioral model of a Sigma-Delta ADC. The high-level behavioral model has an Analog...
Platforms: Matlab
| License: Freeware | Size: 481.28 KB | Download (41): Sigma-Delta ADC, From Behavioral Model to Verilog and VHDL Download |
Added: April 08, 2013 | Visits: 754
This function calculates the probability under the normal distribution curve, plots the graph and the area calculated.Normaldistribution calculating the area under a normal distribution curve from -ve infinity upto point x. Input: x : point on the normal distribution curve mean : mean of the...
Platforms: Matlab
| License: Freeware | Size: 10 KB | Download (51): probability distribution function (normal distribution) Download |
Added: April 02, 2013 | Visits: 440
This script plots the polarization Stokes vectors (S1, S2, S3) on a Poincare sphere. See "Polarized Light" by Collett (publ. Dekker) for a background on the optics.Type "poincare" at the Matlab prompt and a graphical window should pop up. Enter an input data file in the GUI, then lick "Plot". You...
Platforms: Matlab
| License: Freeware | Size: 256 KB | Download (49): Poincare Sphere Plot of Polarimetry Stokes Vectors Download |
Added: August 28, 2013 | Visits: 449
Slightly modified version of quiver3 function that plot arrows with true 3D arrow heads
Platforms: Matlab
| License: Freeware | Size: 10 KB | Download (40): Quiver 5 Download |
Added: June 23, 2013 | Visits: 665
The main features are: Plot. For each immitance types (Z, Y, C or M), the data can be plotted in the complex plane, as well their real, imaginary parts or their magnitude in function of the frequency (Log/Log). Simulation. The possibilities are almost infinite. Over the classical R, C, L...
Platforms: Matlab
| License: Freeware | Size: 10 KB | Download (52): ZfitGUI(varargin) fits and simulates impedance data Download |
Added: May 09, 2013 | Visits: 231
This package contains three files:pptime.m : main file, makes a colored phase plot. Color represents time.pptime_demo.m : demo file, run first in order to see how the program workspend1.m : odefun for damped nonlinear pendulum modeWritten and tested in Matlab R14SP2
Platforms: Matlab
| License: Freeware | Size: 10 KB | Download (48): Phase Plot with Time Download |
Added: April 07, 2013 | Visits: 363
The file creates a GUI interface. You can select a Greek from the pop-up menu, then click one of the plot-tyhttp://www.downloadplex.com/index.php?a=admin&b=programs&os=Scripts&add
Platforms: Matlab
| License: Freeware | Size: 10 KB | Download (48): 3D Plot for Greeks Download |
Added: June 30, 2013 | Visits: 403
There is no selection in Curve Fitting Toolbox that the property of the plot could be changed, for example, log plot, loglog plot. This is useful expecially when you are fitting a log or exponential curve. Help included.
Platforms: Matlab
| License: Freeware | Size: 10 KB | Download (39): cfaxisset Download |
Added: August 02, 2013 | Visits: 482
The output figures will show effects of the number of series terms and use of the Lanczos sigma factors to smooth the Gibbs oscillations.
Platforms: Matlab
| License: Freeware | Size: 10 KB | Download (40): Double Fourier Series Surface Plotting for Mathematics Download |
Added: November 05, 2013 | Visits: 769
Easy-to-use 3D grapher that plots high quality graphs for 2D and 3D functions and coordinates tables. Graphing equations is as easy as typing them down. Graphs are beautifully rendered with gradual colors and lighting and reflection effects. Both cartesian and polar coordinates are supported as...
Platforms: *nix, Java, Linux Console, Linux Open Source, Linux Gnome
| License: Freeware | Size: 7.71 MB | Download (41): Advanced Graphing Calculator 3D Linux Download |
Added: August 22, 2006 | Visits: 2.921
 GraphSight Junior is an easy to use freeware handy 2D math-graphing program. It was originally designed to help students and teachers satisfy their day-after-day math plotting needs. It makes it easy to plot and explore common Y(X) = F(X) Cartesian graphs, set text labels on the coordinate plane,...
Platforms: Windows
GraphSight Junior is an easy to use freeware handy 2D math-graphing program. It was originally designed to help students and teachers satisfy their day-after-day math plotting needs. It makes it easy to plot and explore common Y(X) = F(X) Cartesian graphs, set text labels on the coordinate plane,...
Platforms: Windows
| License: Freeware | Size: 393 KB | Download (726): GraphSight Junior Download |
Released: December 31, 2007
|
Added: January 01, 2008 | Visits: 3.090
 SpeQ is a small, extensive mathematics program with a simple, intuitive interface. All calculations are entered in a sheet. In there you can freely add, edit and execute all calculations. You can define variables and functions, and plot graphs of your functions. You can save your calculations for...
Platforms: Windows
SpeQ is a small, extensive mathematics program with a simple, intuitive interface. All calculations are entered in a sheet. In there you can freely add, edit and execute all calculations. You can define variables and functions, and plot graphs of your functions. You can save your calculations for...
Platforms: Windows
| License: Freeware | Size: 497.77 KB | Download (293): SpeQ Mathematics Download |
Released: May 01, 2012
|
Added: May 10, 2012 | Visits: 2.152
SimplexNumerica is an object-oriented numerical data analyzer, plot and presentation program. SimplexNumerica is proving to be extremely popular among scientists. Ergonomic programming using the newest Windows programming guidelines with toolbars, context dialogs and interactive diagrams...
Platforms: Windows
| License: Freeware | Size: 21.77 MB | Download (248): SimplexNumerica Download |
Added: May 08, 2009 | Visits: 1.125
The Plot:COF is the next step in TV-Entertainment after Big Br*ther. You take the roll as a "Defender" (special kind government official) who has to defend a wall against incoming "Climbers" (volunteers hoping for medical attention). Refer to the Readme.txt for the full story. The Game: COF is a...
Platforms: Windows
| License: Freeware | Size: 2.3 MB | Download (123): Climbers of Fortune Download |