


Roland Plotter freeware
Roland Plotter
Added: September 04, 2013 | Visits: 481
 UVI Analogic Piano 09 takes inspiration from the very first electronic piano ever designed with a built-in arpegiator: the famous Roland EP-09 This "cheezy" instrument was sampled and modeled to capture the pure soul of this analog texture. Sounds were carefully recorded with the very best...
Platforms: Mac
| License: Freeware | Size: 149.95 MB | Download (50): UVI Analogic Piano Download |
Released: November 03, 2012
|
Added: November 03, 2012 | Visits: 657
 Graphics4VO is developed for use with CA-Visual Objects (Version 2.0 upto 2.8). It is based on 32-Bit-WINDOWS-API. The library allows development of graphics oriented CA-Visual Objects applications for 32-Bit Windows operating systems. The Graphics Library Graphics4VO includes classes, methods...
Platforms: Windows
| License: Freeware | Size: 3.84 MB | Download (50): Graphics4VO Graphics DLL Download |
Released: December 25, 2012
|
Added: December 25, 2012 | Visits: 299
 This software is an easy to use 2D mathematical function plotter.
Platforms: Windows, Mac, Linux
| License: Freeware | Size: 42.21 KB | Download (49): freeplot Download |
Added: April 11, 2013 | Visits: 469
I needed to plot some bar charts but I haven't got the financial toolbox. I couldn't find one here so I modified Nagi Hatoum's Candlestick Graph script to display bar charts.**Update 03-30-09**I've also updated Hatoum's candlestick plotter, custom colors are available for both bars and candles....
Platforms: Matlab
| License: Freeware | Size: 10 KB | Download (49): Bar- and candle style graph for stocks Download |
Released: June 22, 2012
|
Added: June 22, 2012 | Visits: 371
The main goal of this project is to create a system-independent MathML rendering engine in Python. This engine works with an abstract 'plotter' driver class, that can be subclassed for any rendering device needed.
Platforms: Windows, Mac, Linux
| License: Freeware | Size: 30.76 KB | Download (49): PyMathML Download |
Added: March 26, 2013 | Visits: 439
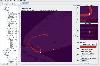
Example in screenshot generated by:energyBoxPlot([10e-9,10e-9,10e-9],[2,2,1],[50e-11,50e-11,50e-11],100)There are a few improvements I want to make to this function; hopefully I have time to do so. At this point, you may have to play with things a bit to get them to look right without locking up...
Platforms: Matlab
| License: Freeware | Size: 10 KB | Download (48): 3D Plotter for Infinite Potential Well Download |
Added: August 22, 2013 | Visits: 307
webkit2png is a Python module that helps you take snapshot of webpages using Webkit and Qt4. Originally taken from the blog post by Roland Tapken at: http://www.blogs.uni-osnabrueck.de/rotapken/2008/12/03/create-screenshots-of-a-web-page-using-python-and-qtwebkit/...
Platforms: *nix
| License: Freeware | Size: 10.24 KB | Download (48): webkit2png Download |
Added: August 14, 2013 | Visits: 355
It can compute and plot a very high amount of functions, including many probability functions and is fairly good configurable.A maximum number of three graphs can be displayed in one image.InstallationUpload the files to the webserver and point your browser to the location of openPlaG.html
Platforms: PHP
| License: Freeware | Size: 51.2 KB | Download (48): openPlaG for Scripts Download |
Released: August 13, 2012
|
Added: August 13, 2012 | Visits: 673
 Graphics4VO is developed for use with CA-Visual Objects (Version 2.0 upto 2.8). It is based on 32-Bit-WINDOWS-API. The library allows development of graphics oriented CA-Visual Objects applications for 32-Bit Windows operating systems. The Graphics Library Graphics4VO includes classes, methods...
Platforms: Windows
| License: Freeware | Size: 4.46 MB | Download (47): Graphics4VO (deutsch) Download |
Released: July 02, 2012
|
Added: July 02, 2012 | Visits: 287
 A software tool enabling the user to browse through an image stack created by a confocal microscope. Points can be plotted through the stack, producing a digital 3D representation, which can be viewed in 3D and compared with other plots.
Platforms: Windows, Mac, Linux
| License: Freeware | Size: 9.97 MB | Download (46): LSM Stack Browser & 3D Plotter Download |
Released: June 21, 2012
|
Added: June 21, 2012 | Visits: 374
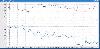 Creates interactive plots of data lines over a time scale. Automatic detection of input format and scale will result in instantaneous results without any need for configuration.
Platforms: Windows, Mac, Linux
| License: Freeware | Size: 21.33 KB | Download (46): Time Data Plotter Download |
Released: August 16, 2015
|
Added: August 22, 2015 | Visits: 586
 Graphics4VO is developed for use with CA-Visual Objects (Version 2.0 upto 2.8). It is based on 32-Bit-WINDOWS-API. The library allows development of graphics oriented CA-Visual Objects applications for 32-Bit Windows operating systems. The Graphics Library Graphics4VO includes classes, methods...
Platforms: Windows, Windows 8, Windows Phone, Windows 7, Windows Server
| License: Freeware | Size: 3.88 MB | Download (45): Graphics4VO Demo Download |
Released: August 01, 2012
|
Added: August 01, 2012 | Visits: 319
MathGL is ...
* a library for making high-quality scientific graphics under Linux and Windows;
* a library for the fast data plotting and handling of large data arrays;
* a library for working in window and console modes and for easy embedding into other programs;
* a library with large and...
Platforms: Mac, Linux
| License: Freeware | Size: 3.8 MB | Download (45): MathGL for Mac OS X & Linux Download |
Released: July 11, 2012
|
Added: July 11, 2012 | Visits: 379
MathGenius is a graphical tool intended to simplify your work in mathematics. By now it includes a graphical function plotter, a mechanism (still in development) to derive functions, and an equation solver. An extension mechanism will be developed.
Platforms: Windows, Mac, Linux
| License: Freeware | Size: 25.72 KB | Download (45): MathGenius Download |
Released: August 08, 2012
|
Added: August 08, 2012 | Visits: 381
Easy-to-learn interactive 2d plot program. Can overlay images, xy-data, and mathematical functions. Function parameters can be tuned with sliders; functions can also be automatically fitted to data. Written in Python, cross-platform, but currently broken
Platforms: Windows, Mac, Linux
| License: Freeware | Size: 179.73 KB | Download (44): descartes: a function and data plotter Download |
Released: November 17, 2012
|
Added: November 17, 2012 | Visits: 343
A user-friendly mathematical plotter. Its main purpose is displaying 2D/3D functions, defined in rectangular, polar and cylindrical coordinates, relations between variables, parametric curves/surfaces and vector fields. It is based on SDL and OpenGL
Platforms: Mac, BSD, Linux
| License: Freeware | Size: 256.91 KB | Download (44): MeTA->phi Download |
Released: July 16, 2012
|
Added: July 16, 2012 | Visits: 477
OxyPlot is a .NET library designed for plotting applications. It was created with focus on simplicity and performance.
The library contains custom controls for WPF, Silverlight and Windows Forms and includes exporters for SVG, PDF, XPS and PNG.
Platforms: Windows
| License: Freeware | Download (44): OxyPlot Download |
Released: October 02, 2012
|
Added: October 02, 2012 | Visits: 367
 JSynoptic renders information graphically. It can be used as a simple graph plotter, or as a complex run-time monitoring environment. The user sets up shapes (like plots) on graphical pages, and uses data sources (ex: ASCII file) to render information.
Platforms: Windows, Mac, Solaris, Linux
| License: Freeware | Size: 20.06 MB | Download (44): JSynoptic - A graphical sheet editor Download |
Added: July 22, 2013 | Visits: 317
By this small MATLAB script it is possible to graphically render the morphological data available in a *.ASC NeuroLucida ascii file. It isthen possible to manipulate it and convert it to a variety of vectorized file format, such as encapsulated postscript.The program at the moment would probably...
Platforms: Matlab
| License: Freeware | Size: 10 KB | Download (43): Michi Shape Plotter Download |
Added: September 02, 2013 | Visits: 638
X File Explorer (Xfe) is an MS-Explorer or Commander like file manager for X. It is based on the popular, but discontinued, X Win Commander, originally developed by Maxim Baranov. Xfe is developed since 2002 by Roland Baudin, a french Linux enthusiast. The answer is quite simple: Although all...
Platforms: *nix
| License: Freeware | Size: 2.17 MB | Download (42): X File Explorer for Linux Download |