


Plotter freeware
Plotter
Added: June 15, 2013 | Visits: 488
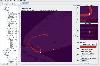
 The Ejs Phase Space Plotter model displays the dynamics of an ensemble of pendula or simple harmonic oscillators in phase space (velocity versus position). Friction is initially set to zero but can be changed via a textbox as can the number of elements in the ensemble. For the pendulum ensemble,...
Platforms: Mac
| License: Freeware | Size: 1.4 MB | Download (37): Phase Space Plotter Model Download |
Added: August 07, 2008 | Visits: 2.149
MSPlotter (Mandelbrot Set Plotter) helps you create fractal images using the Mandelbrot Set and the Julia Set. Just enter values for Center X, Center Y, Range, and Power of Equation, press the "Plot" button to begin the process of rendering your image, which may be saved in bmp format. Options...
Platforms: Windows
| License: Freeware | Size: 1.5 MB | Download (90): Mandelbrot Set Plotter Download |
Released: July 09, 2002
|
Added: June 23, 2006 | Visits: 7.065
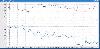
 Ping Plotter is a fast, small, and visual Ping/Trace Route utility that uses multiple threads to trace all hops at once for SUBSTANTIAL performance improvements over standard trace routes. Delivers visual graphs of performance to pinpoint problems and see ranges of responses and trends. Will...
Platforms: Windows
| License: Freeware | Size: 414 KB | Download (818): Ping Plotter Freeware Download |
Added: January 17, 2010 | Visits: 1.442
openPlaG is an online function graph plotter, written in PHP. This application can compute and plot a very high amount of functions, including many probability functions and is fairly good configurable. Instructions: To run the program, youll need access to a web server with PHP 4 or 5 and...
Platforms: *nix
| License: Freeware | Size: 24.58 KB | Download (104): openPlaG Download |
Added: August 01, 2010 | Visits: 1.474
Plotting all 2D and 3D functions had never been so easy. Many samples are included. Its also possible to print or export the plots in postscript format..
Platforms: *nix
| License: Freeware | Size: 43.01 KB | Download (178): SPlotter-3D 1.2 Simple Plotter Download |
Added: January 16, 2010 | Visits: 994
Lybniz project is a simple function graph plotter in Python on GTK. Lybniz allows to plot up to three functions on one graph. It needs no installation - simply one Python script..
Platforms: *nix
| License: Freeware | Size: 12.29 KB | Download (127): Lybniz Download |
Released: August 12, 2011
|
Added: September 26, 2011 | Visits: 3.112
 Basically an equation editor, however not focused over one single equation, but you can write your mathematical artwork over several pages. You can easily move and copy your equations and expressions by mouse touch. Illustrate your equations using hand-drawing tools. Use symbolic calculator and...
Platforms: Windows
| License: Freeware | Size: 681.9 KB | Download (232): Math-o-mir Download |
Added: May 10, 2013 | Visits: 752
Microfi PyPlot is an easy-to-use function plotter. It is completely open-source, so you can edit it as you feel necessary. The main goal of this project is to provide a clean interface for school teachers and students that want to study math.
Platforms: Windows, Mac, *nix, Python, BSD Solaris
| License: Freeware | Download (62): Microfi PyPlot 0.1b Download |
Added: August 03, 2013 | Visits: 431
JGraphSketch is an Open Source cross-platform mathematical function plotter written in Java. You can plot Cartesian, Polar and Parametric equations with it. Here is a screen shot. You can zoom the graph, save it in a PNG file and customize each and every plot settings. The software is very...
Platforms: Mac
| License: Freeware | Size: 10.24 KB | Download (41): JGraphSketch Download |
Added: November 04, 2013 | Visits: 529
Inkcut is a program used to send HPGL directly to cutter or plotter from Inkscape. Inkcut is used for sign making, namely cutting vinyl graphics, letters, and decals. It should support any device that uses HPGL.
Platforms: *nix
| License: Freeware | Size: 153.6 KB | Download (65): Inkcut Download |
Added: August 26, 2008 | Visits: 2.353
 A real-time graph plotter. While your application is computing and logging results to a CSV file using the LiveGraph Writer API, the plotter lets you visualise and monitor the results live - by instantly plotting charts and graphs of the data. A concise user interface allows to manage 100s of...
Platforms: Windows
| License: Freeware | Size: 889 KB | Download (532): LiveGraph Download |
Released: August 16, 2012
|
Added: August 16, 2012 | Visits: 620
The DMM-ProfiLab-Software will allow you to develop any measuring technology projects based upon digital multimeters: A simple curve plotter or a complex measuring technology project.
By the integrated support of relay cards you are not only able to read and process measurement values, you can...
Platforms: Windows
| License: Freeware | Download (455): DMM ProfiLab Download |
Released: August 08, 2012
|
Added: August 08, 2012 | Visits: 382
Easy-to-learn interactive 2d plot program. Can overlay images, xy-data, and mathematical functions. Function parameters can be tuned with sliders; functions can also be automatically fitted to data. Written in Python, cross-platform, but currently broken
Platforms: Windows, Mac, Linux
| License: Freeware | Size: 179.73 KB | Download (44): descartes: a function and data plotter Download |
Released: December 25, 2012
|
Added: December 25, 2012 | Visits: 299
 This software is an easy to use 2D mathematical function plotter.
Platforms: Windows, Mac, Linux
| License: Freeware | Size: 42.21 KB | Download (49): freeplot Download |
Released: July 02, 2012
|
Added: July 02, 2012 | Visits: 287
 A software tool enabling the user to browse through an image stack created by a confocal microscope. Points can be plotted through the stack, producing a digital 3D representation, which can be viewed in 3D and compared with other plots.
Platforms: Windows, Mac, Linux
| License: Freeware | Size: 9.97 MB | Download (46): LSM Stack Browser & 3D Plotter Download |
Released: November 17, 2012
|
Added: November 17, 2012 | Visits: 343
A user-friendly mathematical plotter. Its main purpose is displaying 2D/3D functions, defined in rectangular, polar and cylindrical coordinates, relations between variables, parametric curves/surfaces and vector fields. It is based on SDL and OpenGL
Platforms: Mac, BSD, Linux
| License: Freeware | Size: 256.91 KB | Download (44): MeTA->phi Download |
Released: June 21, 2012
|
Added: June 21, 2012 | Visits: 374
 Creates interactive plots of data lines over a time scale. Automatic detection of input format and scale will result in instantaneous results without any need for configuration.
Platforms: Windows, Mac, Linux
| License: Freeware | Size: 21.33 KB | Download (46): Time Data Plotter Download |
Added: July 22, 2013 | Visits: 317
By this small MATLAB script it is possible to graphically render the morphological data available in a *.ASC NeuroLucida ascii file. It isthen possible to manipulate it and convert it to a variety of vectorized file format, such as encapsulated postscript.The program at the moment would probably...
Platforms: Matlab
| License: Freeware | Size: 10 KB | Download (43): Michi Shape Plotter Download |
Added: March 26, 2013 | Visits: 439
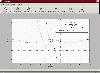
Example in screenshot generated by:energyBoxPlot([10e-9,10e-9,10e-9],[2,2,1],[50e-11,50e-11,50e-11],100)There are a few improvements I want to make to this function; hopefully I have time to do so. At this point, you may have to play with things a bit to get them to look right without locking up...
Platforms: Matlab
| License: Freeware | Size: 10 KB | Download (48): 3D Plotter for Infinite Potential Well Download |
Added: April 11, 2013 | Visits: 469
I needed to plot some bar charts but I haven't got the financial toolbox. I couldn't find one here so I modified Nagi Hatoum's Candlestick Graph script to display bar charts.**Update 03-30-09**I've also updated Hatoum's candlestick plotter, custom colors are available for both bars and candles....
Platforms: Matlab
| License: Freeware | Size: 10 KB | Download (49): Bar- and candle style graph for stocks Download |