


Plot Graphs freeware
Plot Graphs
Released: July 24, 2012
|
Added: July 24, 2012 | Visits: 549
 Gnuplot is a portable command-line driven graphing utility for linux, OS/2, MS Windows, OSX, VMS, and many other platforms. The source code is copyrighted but freely distributed (i.e., you don't have to pay for it). It was originally created to allow scientists and students to visualize...
Platforms: Mac
Gnuplot is a portable command-line driven graphing utility for linux, OS/2, MS Windows, OSX, VMS, and many other platforms. The source code is copyrighted but freely distributed (i.e., you don't have to pay for it). It was originally created to allow scientists and students to visualize...
Platforms: Mac
| License: Freeware | Size: 3.3 MB | Download (435): Gnuplot for Mac OS X Download |
Released: October 25, 2012
|
Added: October 25, 2012 | Visits: 500
 RLPlot is is a plotting program to create high quality graphs from data. Based on values stored in a spreadsheet several menus help you to create graphs of your choice. The Graphs are displayed as you get them (wysiwyg). Double click any element of the graph (or a single click with the right...
Platforms: Windows
RLPlot is is a plotting program to create high quality graphs from data. Based on values stored in a spreadsheet several menus help you to create graphs of your choice. The Graphs are displayed as you get them (wysiwyg). Double click any element of the graph (or a single click with the right...
Platforms: Windows
| License: Freeware | Size: 1.2 MB | Download (455): RLPlot for Mac OS X Download |
Released: July 07, 2012
|
Added: July 07, 2012 | Visits: 921
 Universal oscilloscope GUI ( Real-time plot ) DLL library for data acquisition, simulation, debugging.Advantages:1.Speedy performance: the library makes it possible to bring out into the beams of the viewing oscilloscope over a million quantization steps of signal per second (on the Pentium III...
Platforms: Windows, Windows Vista
Universal oscilloscope GUI ( Real-time plot ) DLL library for data acquisition, simulation, debugging.Advantages:1.Speedy performance: the library makes it possible to bring out into the beams of the viewing oscilloscope over a million quantization steps of signal per second (on the Pentium III...
Platforms: Windows, Windows Vista
| License: Freeware | Size: 3.54 MB | Download (127): Universal Software Oscilloscope Library Download |
Released: September 14, 2012
|
Added: September 14, 2012 | Visits: 631
 Data Master 2003 VCL component library provides you with high performance 2D graphics engine specially optimized for scientific and technical applications as well as other reusable components created for DM2003 software. You can visualize and edit numeric data as plot curves and worksheets,...
Platforms: Windows
Data Master 2003 VCL component library provides you with high performance 2D graphics engine specially optimized for scientific and technical applications as well as other reusable components created for DM2003 software. You can visualize and edit numeric data as plot curves and worksheets,...
Platforms: Windows
| License: Freeware | Size: 307.2 KB | Download (58): Data Master 2003 VCL Download |
Released: June 13, 2012
|
Added: June 13, 2012 | Visits: 452
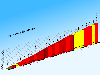 CycloGraph is a handy program to help you plot the gradient of roads using distances and heights. An Open Source alternative to Salitaker for plotting the profile of the roads you are planning to do with your bicycle. It also can import routes from kml. FEATURES: · import kml files · open...
Platforms: Windows
CycloGraph is a handy program to help you plot the gradient of roads using distances and heights. An Open Source alternative to Salitaker for plotting the profile of the roads you are planning to do with your bicycle. It also can import routes from kml. FEATURES: · import kml files · open...
Platforms: Windows
| License: Freeware | Size: 16.2 MB | Download (504): CycloGraph Download |
Released: November 19, 2012
|
Added: November 19, 2012 | Visits: 348
 The Plot.py project tries to supply an easy to use measurement data visualization and treatment framework being easy to use while keeping the freedom for advanced users to execute additional data treatment algorithms. The program is build on a object oriented modular basis to provide the...
Platforms: Linux
The Plot.py project tries to supply an easy to use measurement data visualization and treatment framework being easy to use while keeping the freedom for advanced users to execute additional data treatment algorithms. The program is build on a object oriented modular basis to provide the...
Platforms: Linux
| License: Freeware | Size: 850 KB | Download (485): Plotting GUI for Linux 0.7.13 Beta Download |
Added: May 10, 2013 | Visits: 366
 It can be used to plot only discrete data, not having support for mathematical functions. Limitations: - Does not support functions. - Don't suit all applciations.
Platforms: Windows, Mac, *nix, Python, BSD Solaris
It can be used to plot only discrete data, not having support for mathematical functions. Limitations: - Does not support functions. - Don't suit all applciations.
Platforms: Windows, Mac, *nix, Python, BSD Solaris
| License: Freeware | Download (54): Graphication Download |
Added: May 10, 2013 | Visits: 222
The graphs are accessible under Administer > Logs > Graphs.Installation - Unpack in your modules folder (usually /sites/all/modules/) and enable under Administer > Site Building > Modules. Requirements: - Drupal 5.x
Platforms: Windows, Mac, *nix, PHP, BSD Solaris
| License: Freeware | Download (54): Graphstat Download |
Added: May 10, 2013 | Visits: 494
phpMrtgAdmin is the flexible PHP-based web-tool for monitoring of MRTG-created graphs. The main features of phpMrtgAdmin are: - no any databases - customizable web-interface based on using of templates - presentation of dynamically changed of MRTG data set - show log-file as HTML and...
Platforms: Windows, Mac, *nix, PHP, BSD Solaris
| License: Freeware | Download (52): phpMrtgAdmin Download |
Added: May 10, 2013 | Visits: 451
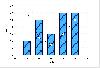
DynaGraph creates dynamic graphs based on data selected from a database query. Using PHP, DynaGraph accesses a MySQL database, and uses the results to plot information to a bar graph in the GIF format, using gd library.
Platforms: Windows, Mac, *nix, PHP, BSD Solaris
| License: Freeware | Download (55): DynaGraph 0.2a-1 Download |
Added: June 12, 2013 | Visits: 384
CrocoPat manipulates relations of any arity, including graphs (which are binary relations). Its simple and expressive query and manipulation language is based on first-order predicate calculus.The implementation is based on the data structure binary decision diagram (BDD), which is well-known as...
Platforms: C and C plus plus
| License: Freeware | Size: 3.66 MB | Download (42): CrocoPat Download |
Added: July 14, 2013 | Visits: 642
DHTML / CSS based line graph script allows you to represent line graphs using only DHTML and CSS.Unlike an applet based solution, this loads fast and blends in with the rest of the page. You can even use a transparent background for it.
Platforms: JavaScript
| License: Freeware | Size: 102.4 KB | Download (50): GreatCharts ScriptDHTML / CSS based line graph Script Download |
Added: August 05, 2013 | Visits: 516
javascript Graph-it helps you to create graphs out of raw data.You must just input the name/value pairs of the involved graph elements, and leave the rest to the script.The values can be either absolute or percentage (using two versions of script). Graph-it allows you to render more than one...
Platforms: JavaScript
| License: Freeware | Size: 102.4 KB | Download (51): javascript Graph-it Script Download |
Added: April 02, 2013 | Visits: 439
This script plots the polarization Stokes vectors (S1, S2, S3) on a Poincare sphere. See "Polarized Light" by Collett (publ. Dekker) for a background on the optics.Type "poincare" at the Matlab prompt and a graphical window should pop up. Enter an input data file in the GUI, then lick "Plot". You...
Platforms: Matlab
| License: Freeware | Size: 256 KB | Download (49): Poincare Sphere Plot of Polarimetry Stokes Vectors Download |
Added: August 12, 2013 | Visits: 480
This workbook teaches students how to use MATLAB and Simulink to perform calculations and generate graphs essential to control system analysis.For a full book description and ordering information, please refer to http://www.mathworks.com/support/books/book1301.jsp.
Platforms: Matlab
| License: Freeware | Size: 51.2 KB | Download (48): Using MATLAB to Analyze and Design Control Systems, 2e Download |
Added: August 28, 2013 | Visits: 449
Slightly modified version of quiver3 function that plot arrows with true 3D arrow heads
Platforms: Matlab
| License: Freeware | Size: 10 KB | Download (40): Quiver 5 Download |
Added: August 07, 2013 | Visits: 466
This demo gives a clear visual presentation of what happens during the Adaboost algorithms. It shows how the decision boundary, example weights, training error and base learner weights change during training.A selection of base learning algorithms are included: Linear Regression, Naive Bayes,...
Platforms: Matlab
| License: Freeware | Size: 10 KB | Download (56): Boosting Demo Download |
Added: August 22, 2013 | Visits: 489
A simple Bayesian Network example for exact probabilistic inference using Pearl's message-passing algorithm on singly connected graphs.
Platforms: Matlab
| License: Freeware | Size: 61.44 KB | Download (40): Modeling Lung Cancer Diagnosis Using Bayesian Network Inference Download |
Added: June 23, 2013 | Visits: 665
The main features are: Plot. For each immitance types (Z, Y, C or M), the data can be plotted in the complex plane, as well their real, imaginary parts or their magnitude in function of the frequency (Log/Log). Simulation. The possibilities are almost infinite. Over the classical R, C, L...
Platforms: Matlab
| License: Freeware | Size: 10 KB | Download (52): ZfitGUI(varargin) fits and simulates impedance data Download |
Added: May 09, 2013 | Visits: 231
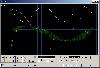
This package contains three files:pptime.m : main file, makes a colored phase plot. Color represents time.pptime_demo.m : demo file, run first in order to see how the program workspend1.m : odefun for damped nonlinear pendulum modeWritten and tested in Matlab R14SP2
Platforms: Matlab
| License: Freeware | Size: 10 KB | Download (48): Phase Plot with Time Download |