


Plot Graph freeware
Plot Graph
Released: September 12, 2012
|
Added: September 12, 2012 | Visits: 707
 DataScene Professional is a scientific application that helps you design graphs and graph animation. It is also capable to perform data analysis, curve fitting, and data monitoring.
It allows the user to easily plot 2D & 3D graphs (Area, Bar, Pie, Line, Surface, Ploar, and more), to manipulate,...
Platforms: Windows
DataScene Professional is a scientific application that helps you design graphs and graph animation. It is also capable to perform data analysis, curve fitting, and data monitoring.
It allows the user to easily plot 2D & 3D graphs (Area, Bar, Pie, Line, Surface, Ploar, and more), to manipulate,...
Platforms: Windows
| License: Freeware | Download (459): DataScene Professional Download |
Released: July 07, 2012
|
Added: July 07, 2012 | Visits: 919
 Universal oscilloscope GUI ( Real-time plot ) DLL library for data acquisition, simulation, debugging.Advantages:1.Speedy performance: the library makes it possible to bring out into the beams of the viewing oscilloscope over a million quantization steps of signal per second (on the Pentium III...
Platforms: Windows, Windows Vista
Universal oscilloscope GUI ( Real-time plot ) DLL library for data acquisition, simulation, debugging.Advantages:1.Speedy performance: the library makes it possible to bring out into the beams of the viewing oscilloscope over a million quantization steps of signal per second (on the Pentium III...
Platforms: Windows, Windows Vista
| License: Freeware | Size: 3.54 MB | Download (127): Universal Software Oscilloscope Library Download |
Added: May 10, 2013 | Visits: 757
This open source, digitizing software converts an image file showing a graph or map, into numbers. The image file can come from a scanner, digital camera or screenshot. The numbers can be read on the screen, and written or copied to a spreadsheet. The process starts with an image file containing...
Platforms: Windows, Mac, *nix, C/C++, BSD
| License: Freeware | Download (60): Engauge Digitizer Download |
Released: December 31, 2007
|
Added: January 01, 2008 | Visits: 3.090
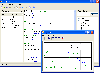 SpeQ is a small, extensive mathematics program with a simple, intuitive interface. All calculations are entered in a sheet. In there you can freely add, edit and execute all calculations. You can define variables and functions, and plot graphs of your functions. You can save your calculations for...
Platforms: Windows
SpeQ is a small, extensive mathematics program with a simple, intuitive interface. All calculations are entered in a sheet. In there you can freely add, edit and execute all calculations. You can define variables and functions, and plot graphs of your functions. You can save your calculations for...
Platforms: Windows
| License: Freeware | Size: 497.77 KB | Download (293): SpeQ Mathematics Download |
Added: May 10, 2013 | Visits: 670
Graphist presents plots of data as GIF, JPEG, or PNG images. Though PHP is used by Graphist to produce the image, pages that use its images can be ordinary HTML. These images are added to a web page the same way as any image, such as a corporate logo or picture of your dog: an IMG tag. The tag's...
Platforms: Windows, Mac, *nix, PHP, BSD Solaris
| License: Freeware | Download (69): Graphist Download |
Added: January 04, 2006 | Visits: 2.432
 Math software is often bulky, overloaded with useless features and requires reading huge manual before attempting to use it. SLGallery is the unique probability distribution calculation toolbox featuring 11 continuous and 4 discrete functions. With SLGallery it is possible to plot graph and find...
Platforms: Windows
Math software is often bulky, overloaded with useless features and requires reading huge manual before attempting to use it. SLGallery is the unique probability distribution calculation toolbox featuring 11 continuous and 4 discrete functions. With SLGallery it is possible to plot graph and find...
Platforms: Windows
| License: Freeware | Size: 489 KB | Download (252): SLGallery Download |
Added: October 23, 2010 | Visits: 2.094
Bio::Tools::Run::PiseApplication::charge is a Perl module. Bio::Tools::Run::PiseApplication::charge Bioperl class for: CHARGE Protein charge plot (EMBOSS) Parameters: (see also: http://bioweb.pasteur.fr/seqanal/interfaces/charge.html for available values): charge (String) init...
Platforms: *nix
| License: Freeware | Size: 829.44 KB | Download (101): Bio::Tools::Run::PiseApplication::charge Download |
Added: November 23, 2010 | Visits: 1.183
Bio::Tools::Run::PiseApplication::freak is a Perl module. Bio::Tools::Run::PiseApplication::freak Bioperl class for: FREAK Residue/base frequency table or plot (EMBOSS) Parameters: (see also: http://bioweb.pasteur.fr/seqanal/interfaces/freak.html for available values): freak...
Platforms: *nix
| License: Freeware | Size: 829.44 KB | Download (94): Bio::Tools::Run::PiseApplication::freak Download |
Released: August 22, 2012
|
Added: August 22, 2012 | Visits: 434
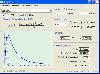
MathGV application was designed to be a mathematical function graphing software.
The MathGV interface is dialogue driven and allows changes to any setting at any time with immediate results. This instant visual feedback makes mathematical functions much easier to understand.
Platforms: Windows, 2003, Windows Vista, 7
| License: Freeware | Download (446): MathGV Download |
Released: July 16, 2012
|
Added: July 16, 2012 | Visits: 481
OxyPlot is a .NET library designed for plotting applications. It was created with focus on simplicity and performance.
The library contains custom controls for WPF, Silverlight and Windows Forms and includes exporters for SVG, PDF, XPS and PNG.
Platforms: Windows
| License: Freeware | Download (44): OxyPlot Download |
Added: October 14, 2010 | Visits: 1.658
GD::Graph is a graph plotting module for Perl 5. SYNOPSIS use GD::Graph::moduleName; GD::Graph is a perl5 module to create charts using the GD module. The following classes for graphs with axes are defined: GD::Graph::lines Create a line chart. GD::Graph::bars and GD::Graph::hbars...
Platforms: *nix
| License: Freeware | Size: 143.36 KB | Download (111): GD::Graph Download |
Added: January 18, 2010 | Visits: 2.272
Chart::Graph::Gnuplot is a function in module Chart::Graph that lets you generate graphs on the fly in perl. SYNOPSIS use Chart::Graph::Gnuplot qw(&gnuplot); gnuplot(%global_options, [%data_set_options, @matrix], [%data_set_options, @x_column, @y_column], [%data_set_options, < filename...
Platforms: *nix
| License: Freeware | Size: 8.19 KB | Download (173): Chart::Graph::Gnuplot Download |
Added: September 03, 2010 | Visits: 2.150
SVG::Graph is a Perl module to visualize your data in Scalable Vector Graphics (SVG) format. SYNOPSIS use SVG::Graph; use SVG::Graph::Data; use SVG::Graph::Data::Datum; #create a new SVG document to plot in... my $graph = SVG::Graph->new(width=>600,height=>600,margin=>30); #and create...
Platforms: *nix
| License: Freeware | Size: 88.06 KB | Download (151): SVG::Graph Download |
Added: January 09, 2010 | Visits: 2.554
Chart::Plot::Canvas is a Perl module to plot two dimensional data in an Tk Canvas. SYNOPSIS use Chart::Plot::Canvas; my $img = Chart::Plot::Canvas->new(); my $anotherImg = Chart::Plot::Canvas->new ($image_width, $image_height); $img->setData (@dataset) or die( $img->error() );...
Platforms: *nix
| License: Freeware | Size: 5.12 KB | Download (162): Chart::Plot::Canvas Download |
Added: April 19, 2010 | Visits: 1.252
SVG::Template::Graph is a Perl extension for generating template-driven graphs with SVG. SYNOPSIS use SVG::Template::Graph; $data = [ { barGraph=>1,# barSpace=>20, title=> 1: Trace 1, data => #hash ref containing x-val and y-val array refs { x_val => [50,100,150,200,250,...
Platforms: *nix
| License: Freeware | Download (99): SVG::Template::Graph Download |
Added: January 22, 2010 | Visits: 1.656
Chart::Plot is a Perl module to plot two dimensional data in an image. SYNOPSIS use Chart::Plot; my $img = Chart::Plot->new(); my $anotherImg = Chart::Plot->new ($image_width, $image_height); $img->setData (@dataset) or die( $img->error() ); $img->setData (@xdataset, @ydataset);...
Platforms: *nix
| License: Freeware | Size: 15.36 KB | Download (116): Chart::Plot Download |
Added: May 10, 2013 | Visits: 562
This vertical bar graph is done completely using DHTML and CSS. Unlike an applet based solution, this loads fast and blends in with the rest of the page. You can even use a transparent background for it.
Platforms: Windows, Mac, *nix, JavaScript, BSD Solaris
| License: Freeware | Download (58): DHTML / CSS based bar graph Download |
Added: January 18, 2010 | Visits: 1.670
Chart::Graph::Xrt3d is a Perl module for creating 3D graph charts. SYNOPSIS #Include module use Chart::Graph::Xrt3d qw(xrt3d); # Function call xrt3d(%options, @data_set ); This module is unmaintained, it worked with Sitrakas XRT, and hasnt been tested against newer versions. Sitraka...
Platforms: *nix
| License: Freeware | Size: 245.76 KB | Download (169): Chart::Graph::Xrt3d Download |
Added: January 18, 2010 | Visits: 1.437
Chart::Graph::Xrt2d is a Perl module for creating graph charts. SYNOPSIS #Include module use Chart::Graph::Xrt2d qw(xrt2d); # Function call xrt2d(%options, [%data_options1, @data_set1], [%data_options2, @data_set2], . . ); This module is unmaintained, it worked with Sitrakas XRT,...
Platforms: *nix
| License: Freeware | Size: 245.76 KB | Download (124): Chart::Graph::Xrt2d Download |
Added: October 09, 2010 | Visits: 1.086
Graph::ModularDecomposition is a Perl module for modular decomposition of directed graphs. SYNOPSIS use Graph::ModularDecomposition qw(pairstring_to_graph tree_to_string); my $g = new Graph::ModularDecomposition; my $h = $g->pairstring_to_graph( ab,ac,bc ); print "yesn" if...
Platforms: *nix
| License: Freeware | Size: 13.31 KB | Download (96): Graph::ModularDecomposition Download |