


Plot Function freeware
Plot Function
Released: August 23, 2012
|
Added: August 23, 2012 | Visits: 709
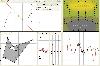
 Function Plot 2D is a small, simple, Java based application specially designed to help you create function plots.
Function Plot 2D lets you create a 2D plot, all you need to do is give an input function.
for WindowsAll
Platforms: Windows
Function Plot 2D is a small, simple, Java based application specially designed to help you create function plots.
Function Plot 2D lets you create a 2D plot, all you need to do is give an input function.
for WindowsAll
Platforms: Windows
| License: Freeware | Download (443): Function Plot 2D Download |
Released: August 23, 2012
|
Added: August 23, 2012 | Visits: 756
Function Plot 2D with Sections is a small, simple, Java based application specially designed to help you create function plots.
Function Plot 2D lets you create a 2D plot, all you need to do is give an input function.
for WindowsAll
Platforms: Windows
| License: Freeware | Download (449): Function Plot 2D with Sections Download |
Released: June 10, 2012
|
Added: June 10, 2012 | Visits: 391
ZeGrapher was designed to be a fast an easy-to-use mathematical function plotting application.
This handy tool can be specially suitable for high school students that need to plot different functions.
Platforms: Windows, Windows Vista, 7
| License: Freeware | Download (422): ZeGrapher Download |
Added: July 27, 2013 | Visits: 414
PLOTPHYTREE(TREE) renders a phylogenetic tree object into a MATLAB figure as aphylogram with equal angle algorithm.plotphytree(...,'ROTATION',value) will orient the phylogenetic tree within the figure window. Positive angles cause counterclockwise rotation, otherwise clockwise...
Platforms: Matlab
| License: Freeware | Size: 10 KB | Download (44): plotphytree Download |
Released: July 19, 2012
|
Added: July 19, 2012 | Visits: 417
 math4u2 ist ein Computer-Mathematik-System, speziell konzipiert fur den Einsatz in der Vorlesung, im Unterricht und beim Selbststudium. Das math4u2-System besteht aus dem math4u2-Tool und dem math4u2-Server. math4u2 ist ein Projekt der Fachhochschule Augsburg. Speziell fur Prasentationen und...
Platforms: Windows
math4u2 ist ein Computer-Mathematik-System, speziell konzipiert fur den Einsatz in der Vorlesung, im Unterricht und beim Selbststudium. Das math4u2-System besteht aus dem math4u2-Tool und dem math4u2-Server. math4u2 ist ein Projekt der Fachhochschule Augsburg. Speziell fur Prasentationen und...
Platforms: Windows
| License: Freeware | Size: 18.78 MB | Download (528): math4u2 (Win + VM) Download |
Added: May 22, 2013 | Visits: 332
This program places dates on time axis as DATETICK and works with ZOOM and PAN as DATETICKZOOM by Christophe Lauwerys. But, it also shows the full date after zooming or panning by using the ticks and time-axis label. So, if you zoom in down to second, you won't loose "when" you are.The input...
Platforms: Matlab
| License: Freeware | Size: 10 KB | Download (50): tlabel.m (Sep 2009) Download |
Added: June 27, 2013 | Visits: 407
A minor improvement on the fminsearchbnd (bounded fminsearch) created by John D'Errico. Changes:% Changes from fminsearchbnd:Changes from fminsearchbnd:1) in options structure, user may pass an 'output function' and 'plot function' to fminsearch.Original fminsearchbnd handled the output function...
Platforms: Matlab
| License: Freeware | Size: 10 KB | Download (45): fminsearchbnd new Download |
Added: April 06, 2013 | Visits: 383
Creates a file in kmz format that can be opened into Google Earth.GEplot uses the same syntax as the traditional plot function but requires Latitude and Longitude (WGS84) instead of x and y.Examples:GEplot('my_track',Lat,Lon);GEplot('my_track',Lat,Lon,'o-r','MarkerSize',10,'LineWidth',3)Colors...
Platforms: Matlab
| License: Freeware | Size: 30.72 KB | Download (45): GEplot Download |
Added: October 24, 2013 | Visits: 535
The Complex Function Plot program displays a user-defined complex function of position and time using representations that map phase into color. The default complex function is a time-dependent complex Gaussian and the representation can be changed by selecting a radio button. Additional...
Platforms: Mac
| License: Freeware | Size: 61.44 KB | Download (37): Complex Function Plot Download |
Added: August 13, 2013 | Visits: 582
This function plot in the same figure the center trajectory and attitude of an aircraft. See the figure to understand better.The version 2.0, extend the functionality of version 1. In this version there are much more body models [for example the tomcat (see the figure), the shuttle, the mig,...
Platforms: Matlab
| License: Freeware | Size: 1.74 MB | Download (43): Trajectory and Attitude Plot Version 2 Download |
Added: July 11, 2013 | Visits: 477
The available function to draw the Nyquist plot doesn't give the proper image of function. So here is the code to get the clear image.
Platforms: Matlab
| License: Freeware | Size: 10 KB | Download (43): Matlab, Nyquist, Power system, Plots, Nyquist plot. Download |
Added: March 27, 2013 | Visits: 469
This function makes an imagesc-like plot for two matrices with equal dimensions, in which each each cell of the plot is split diagonally with the upper triangle of cell (i,j) in the plot representing the Matrix1(i,j) and the lower triangle representing Matrix2(i,j).
Platforms: Matlab
| License: Freeware | Size: 10 KB | Download (43): Overlay 2 matrices in an imagesc-like plot Download |
Added: August 28, 2013 | Visits: 449
Slightly modified version of quiver3 function that plot arrows with true 3D arrow heads
Platforms: Matlab
| License: Freeware | Size: 10 KB | Download (40): Quiver 5 Download |
Added: July 11, 2013 | Visits: 451
The script plots the envelope of the bode plot for a parametric uncertain/interval system.interval_bode(NumVec,DenVec,clr)The function accepts the numerator (NumVec) and denominator (DenVec) of the uncertain system as matrices of two rows each. The first row containing the lower bounds and the...
Platforms: Matlab
| License: Freeware | Size: 10 KB | Download (43): Interval Bode Plot Download |
Added: May 16, 2013 | Visits: 450
This function plot in the same figure the center trajectory and attitude of an aircraft. See the figure to understand better.The version 3.0, extend the functionality of version 2.In this last version :- fixed the Reference System Bugs- possibility to export the trajectory animation in avi format...
Platforms: Matlab
| License: Freeware | Size: 10 KB | Download (46): Trajectory and Attitude Plot Version 3 Download |
Added: May 11, 2010 | Visits: 1.165
CoreLinux++ Function Load Library (libclfll++) takes advantage of the abstract Library Load framework in the CoreLinux libclfw++ library by providing management of loading Linux shared libraries. Application developers define function objects as wrappers and can then dynamically load the...
Platforms: *nix
| License: Freeware | Size: 93.18 KB | Download (95): CoreLinux++ Function Load Library Download |
Added: January 09, 2010 | Visits: 2.554
Chart::Plot::Canvas is a Perl module to plot two dimensional data in an Tk Canvas. SYNOPSIS use Chart::Plot::Canvas; my $img = Chart::Plot::Canvas->new(); my $anotherImg = Chart::Plot::Canvas->new ($image_width, $image_height); $img->setData (@dataset) or die( $img->error() );...
Platforms: *nix
| License: Freeware | Size: 5.12 KB | Download (162): Chart::Plot::Canvas Download |
Added: October 19, 2010 | Visits: 905
Getopt::Function is a Perl module to provide mixed options with help information. SYNOPSIS use Getopt::Function qw(maketrue makevalue); $::opthandler = new Getopt::Function [ ], { => [ , , ] } $result = GetOptions (...option-descriptions...); $::opthandler->std_opts;...
Platforms: *nix
| License: Freeware | Size: 13.31 KB | Download (92): Getopt::Function Download |
Added: January 22, 2010 | Visits: 1.656
Chart::Plot is a Perl module to plot two dimensional data in an image. SYNOPSIS use Chart::Plot; my $img = Chart::Plot->new(); my $anotherImg = Chart::Plot->new ($image_width, $image_height); $img->setData (@dataset) or die( $img->error() ); $img->setData (@xdataset, @ydataset);...
Platforms: *nix
| License: Freeware | Size: 15.36 KB | Download (116): Chart::Plot Download |
Released: July 16, 2012
|
Added: July 16, 2012 | Visits: 797
 With NH's Function Point Analyzer it is easy to get a quick and clear documentation of function point countings according to IFPUG (International Function Point Users Group) standard 4.2. While counting, you will record functions and databases in NH's Function Point Analyzer and the function...
Platforms: Windows
With NH's Function Point Analyzer it is easy to get a quick and clear documentation of function point countings according to IFPUG (International Function Point Users Group) standard 4.2. While counting, you will record functions and databases in NH's Function Point Analyzer and the function...
Platforms: Windows
| License: Freeware | Size: 778.24 KB | Download (51): NH's Function Point Analyzer Download |