


Plot Dataset freeware
Plot Dataset
Released: October 21, 2012
|
Added: October 21, 2012 | Visits: 472
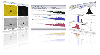
 Kst is the fastest real-time large-dataset viewing and plotting tool available (you may be interested in some benchmarks) and has built-in data analysis functionality. Kst is very user-friendly (both the community and the program itself!). Kst contains many powerful built-in features and is...
Platforms: Linux
Kst is the fastest real-time large-dataset viewing and plotting tool available (you may be interested in some benchmarks) and has built-in data analysis functionality. Kst is very user-friendly (both the community and the program itself!). Kst contains many powerful built-in features and is...
Platforms: Linux
| License: Freeware | Size: 10.8 MB | Download (464): Kst for Linux Download |
Released: October 03, 2012
|
Added: October 03, 2012 | Visits: 440
 Kst is the fastest real-time large-dataset viewing and plotting tool available (you may be interested in some benchmarks) and has built-in data analysis functionality. Kst is very user-friendly (both the community and the program itself!). Kst contains many powerful built-in features and is...
Platforms: Windows
Kst is the fastest real-time large-dataset viewing and plotting tool available (you may be interested in some benchmarks) and has built-in data analysis functionality. Kst is very user-friendly (both the community and the program itself!). Kst contains many powerful built-in features and is...
Platforms: Windows
| License: Freeware | Size: 10.1 MB | Download (454): Kst Download |
Released: November 14, 2012
|
Added: November 14, 2012 | Visits: 475
 Kst is the fastest real-time large-dataset viewing and plotting tool available (you may be interested in some benchmarks) and has built-in data analysis functionality. Kst is very user-friendly (both the community and the program itself!). Kst contains many powerful built-in features and is...
Platforms: Mac
Kst is the fastest real-time large-dataset viewing and plotting tool available (you may be interested in some benchmarks) and has built-in data analysis functionality. Kst is very user-friendly (both the community and the program itself!). Kst contains many powerful built-in features and is...
Platforms: Mac
| License: Freeware | Size: 22.9 MB | Download (482): Kst for Mac OS X Download |
Added: January 09, 2010 | Visits: 2.554
 Chart::Plot::Canvas is a Perl module to plot two dimensional data in an Tk Canvas. SYNOPSIS use Chart::Plot::Canvas; my $img = Chart::Plot::Canvas->new(); my $anotherImg = Chart::Plot::Canvas->new ($image_width, $image_height); $img->setData (@dataset) or die( $img->error() );...
Platforms: *nix
Chart::Plot::Canvas is a Perl module to plot two dimensional data in an Tk Canvas. SYNOPSIS use Chart::Plot::Canvas; my $img = Chart::Plot::Canvas->new(); my $anotherImg = Chart::Plot::Canvas->new ($image_width, $image_height); $img->setData (@dataset) or die( $img->error() );...
Platforms: *nix
| License: Freeware | Size: 5.12 KB | Download (162): Chart::Plot::Canvas Download |
Added: January 22, 2010 | Visits: 1.656
Chart::Plot is a Perl module to plot two dimensional data in an image. SYNOPSIS use Chart::Plot; my $img = Chart::Plot->new(); my $anotherImg = Chart::Plot->new ($image_width, $image_height); $img->setData (@dataset) or die( $img->error() ); $img->setData (@xdataset, @ydataset);...
Platforms: *nix
| License: Freeware | Size: 15.36 KB | Download (116): Chart::Plot Download |
Released: August 23, 2012
|
Added: August 23, 2012 | Visits: 709
Function Plot 2D is a small, simple, Java based application specially designed to help you create function plots.
Function Plot 2D lets you create a 2D plot, all you need to do is give an input function.
for WindowsAll
Platforms: Windows
| License: Freeware | Download (443): Function Plot 2D Download |
Released: August 23, 2012
|
Added: August 23, 2012 | Visits: 756
Function Plot 2D with Sections is a small, simple, Java based application specially designed to help you create function plots.
Function Plot 2D lets you create a 2D plot, all you need to do is give an input function.
for WindowsAll
Platforms: Windows
| License: Freeware | Download (449): Function Plot 2D with Sections Download |
Added: August 13, 2013 | Visits: 582
This function plot in the same figure the center trajectory and attitude of an aircraft. See the figure to understand better.The version 2.0, extend the functionality of version 1. In this version there are much more body models [for example the tomcat (see the figure), the shuttle, the mig,...
Platforms: Matlab
| License: Freeware | Size: 1.74 MB | Download (43): Trajectory and Attitude Plot Version 2 Download |
Added: June 20, 2013 | Visits: 480
Modify the size of dataset without changing values. It acts as oversampling and downsampling functionalitiesfor exampledata1 = Modifysize(data,1000);the above statement will cause data1 has the same values as data but distributed over 1000 samples regardless of what the actual size of data.
Platforms: Matlab
| License: Freeware | Size: 10 KB | Download (48): Resize dataset Download |
Added: April 12, 2013 | Visits: 622
Syntax: plotdata; plotdata(hPlotFig); plotdata(figureName,sheetName,xdata,ydata, xAxisName,yHeaders,...); [hDataFig, hSpreadsheet] = plotdata(...); PLOTDATA(hPlotFig) scans the supplied figure handle for any plot axes; for each plot axes found, a new spreadsheet is created with the plot data...
Platforms: Matlab
| License: Freeware | Size: 40.96 KB | Download (46): PlotData - display plot raw-data in data-tables Download |
Added: April 14, 2013 | Visits: 592
I wrote this to plot some overlapping data sets with there means and regions of +/- std deviations shown. It could be used for other purposes though.
Platforms: Matlab
| License: Freeware | Size: 10 KB | Download (47): Plot Overlapping Regions With Lines Download |
Released: August 24, 2012
|
Added: August 24, 2012 | Visits: 561
 Coulson Plot Generator application creates a multiple pie diagram, for comparing subunit occupancy across a range of entities. Numbers of pies, segments, labels and colours are customisable. Creates an editable PDF from a comma separated text file.
Platforms: Windows, Mac, Solaris, Linux
Coulson Plot Generator application creates a multiple pie diagram, for comparing subunit occupancy across a range of entities. Numbers of pies, segments, labels and colours are customisable. Creates an editable PDF from a comma separated text file.
Platforms: Windows, Mac, Solaris, Linux
| License: Freeware | Size: 150.49 KB | Download (48): Coulson Plot Generator Download |
Released: October 05, 2012
|
Added: October 05, 2012 | Visits: 325
DataSet library is Java based library which is table form datacontainer in memory. It has fixed number of columns and varying numbers of rows. It read and write data from datasource through pluggable engines. Connection to SQL/JDBC databases is supported
Platforms: Windows, Mac, Linux
| License: Freeware | Size: 62.89 KB | Download (54): DataSet library Download |
Added: September 10, 2013 | Visits: 480
Plot Digitizer is a Java program used to digitize scanned plots of functional data. Often data is found presented in reports and references as functional X-Y type scatter or line plots. In order to use this data, it must somehow be digitized. This program will allow you to take a scanned image of...
Platforms: Mac
| License: Freeware | Size: 1.16 MB | Download (47): Plot Digitizer Download |
Released: June 18, 2012
|
Added: June 18, 2012 | Visits: 349
Portable Plot is a pure ansi/iso c++ plot library that makes the construction of native plot widgets easy.
Platforms: Windows, Mac, Linux
| License: Freeware | Size: 456.67 KB | Download (45): portable plot Download |
Added: July 11, 2013 | Visits: 477
The available function to draw the Nyquist plot doesn't give the proper image of function. So here is the code to get the clear image.
Platforms: Matlab
| License: Freeware | Size: 10 KB | Download (43): Matlab, Nyquist, Power system, Plots, Nyquist plot. Download |
Added: July 11, 2013 | Visits: 451
The script plots the envelope of the bode plot for a parametric uncertain/interval system.interval_bode(NumVec,DenVec,clr)The function accepts the numerator (NumVec) and denominator (DenVec) of the uncertain system as matrices of two rows each. The first row containing the lower bounds and the...
Platforms: Matlab
| License: Freeware | Size: 10 KB | Download (43): Interval Bode Plot Download |
Added: March 27, 2013 | Visits: 469
This function makes an imagesc-like plot for two matrices with equal dimensions, in which each each cell of the plot is split diagonally with the upper triangle of cell (i,j) in the plot representing the Matrix1(i,j) and the lower triangle representing Matrix2(i,j).
Platforms: Matlab
| License: Freeware | Size: 10 KB | Download (43): Overlay 2 matrices in an imagesc-like plot Download |
Added: June 21, 2013 | Visits: 507
You have to give it the coordinates of the ends, number of coils, natural length and radius and it gives to you the (xs,ys) coordinates of the spring points, ready to use it with plot(). The picture shows an instant image of an animation of two coupled-pendulums oscillating Type for usage. Don't...
Platforms: Matlab
| License: Freeware | Size: 10 KB | Download (43): Spring() To plot and animate a 2D-Spring Download |
Added: May 16, 2013 | Visits: 450
This function plot in the same figure the center trajectory and attitude of an aircraft. See the figure to understand better.The version 3.0, extend the functionality of version 2.In this last version :- fixed the Reference System Bugs- possibility to export the trajectory animation in avi format...
Platforms: Matlab
| License: Freeware | Size: 10 KB | Download (46): Trajectory and Attitude Plot Version 3 Download |