


Graph Scatter Plot freeware
Graph Scatter Plot
Added: April 27, 2013 | Visits: 714
 This vertical bar graph is done completely using DHTML and CSS. Unlike an applet based solution, this loads fast and blends in with the rest of the page. You can even use a transparent background for it.
Platforms: JavaScript
This vertical bar graph is done completely using DHTML and CSS. Unlike an applet based solution, this loads fast and blends in with the rest of the page. You can even use a transparent background for it.
Platforms: JavaScript
| License: Freeware | Size: 102.4 KB | Download (45): DHTML / CSS based bar graph Script Download |
Added: August 05, 2013 | Visits: 517
javascript Graph-it helps you to create graphs out of raw data.You must just input the name/value pairs of the involved graph elements, and leave the rest to the script.The values can be either absolute or percentage (using two versions of script). Graph-it allows you to render more than one...
Platforms: JavaScript
| License: Freeware | Size: 102.4 KB | Download (51): javascript Graph-it Script Download |
Added: August 13, 2013 | Visits: 582
This function plot in the same figure the center trajectory and attitude of an aircraft. See the figure to understand better.The version 2.0, extend the functionality of version 1. In this version there are much more body models [for example the tomcat (see the figure), the shuttle, the mig,...
Platforms: Matlab
| License: Freeware | Size: 1.74 MB | Download (43): Trajectory and Attitude Plot Version 2 Download |
Added: April 12, 2013 | Visits: 623
Syntax: plotdata; plotdata(hPlotFig); plotdata(figureName,sheetName,xdata,ydata, xAxisName,yHeaders,...); [hDataFig, hSpreadsheet] = plotdata(...); PLOTDATA(hPlotFig) scans the supplied figure handle for any plot axes; for each plot axes found, a new spreadsheet is created with the plot data...
Platforms: Matlab
| License: Freeware | Size: 40.96 KB | Download (46): PlotData - display plot raw-data in data-tables Download |
Added: April 11, 2013 | Visits: 475
I needed to plot some bar charts but I haven't got the financial toolbox. I couldn't find one here so I modified Nagi Hatoum's Candlestick Graph script to display bar charts.**Update 03-30-09**I've also updated Hatoum's candlestick plotter, custom colors are available for both bars and candles....
Platforms: Matlab
| License: Freeware | Size: 10 KB | Download (49): Bar- and candle style graph for stocks Download |
Added: April 14, 2013 | Visits: 593
I wrote this to plot some overlapping data sets with there means and regions of +/- std deviations shown. It could be used for other purposes though.
Platforms: Matlab
| License: Freeware | Size: 10 KB | Download (47): Plot Overlapping Regions With Lines Download |
Added: April 20, 2013 | Visits: 736
The 2D / 3D Line Graph provides both a client and server side solution for the incorporation of line graphs and charts into web pages.It provides versatile components so that web authors and Java developers can easily build and publish dynamic and interactive line charts.Both the applet and...
Platforms: PHP
| License: Freeware | Size: 358.4 KB | Download (53): 2D 3D Line Graph for Scripts Download |
Added: April 25, 2013 | Visits: 664
The 3D Stacked Horizontal Bar Graph software provides both a client and server side solution for the incorporation of bar graphs and charts into web pages.It provides versatile components so that web authors and Java developers can easily build and publish dynamic and interactive bar charts.Both...
Platforms: PHP
| License: Freeware | Size: 389.12 KB | Download (51): 2D 3D Stacked Horizontal Bar Graph for Scripts Download |
Added: June 26, 2013 | Visits: 635
2D / 3D Horizontal Bar Graph provides both a client and server side solution for the incorporation of bar graphs and charts into web pages.It provides versatile components so that web authors and Java developers can easily build and publish dynamic and interactive bar charts. Both the applet and...
Platforms: PHP
| License: Freeware | Size: 389.12 KB | Download (51): 2D 3D Horizontal Bar Graph for Scripts Download |
Added: July 12, 2013 | Visits: 737
PHP Advanced Graph & Chart script adds powerful reporting features to your Web / Intranet pages and applications.The PHP graphing scripts provide a very easy way to embed dynamically generated graphs and charts into PHP applications and HTML web pages.The graphing software is very easy to use and...
Platforms: PHP
| License: Freeware | Size: 952.32 KB | Download (49): PHP Advanced Graph & Chart for Scripts Download |
Added: April 24, 2013 | Visits: 541
PHP Graph creates a simple dynamic PHP bar graph from session data.Customisable Features:- Bar Colour- Bar Height- Grid Space- Title- Footer
Platforms: PHP
| License: Freeware | Size: 10 KB | Download (48): PHP Graph for Scripts Download |
Released: February 04, 2020
|
Added: February 06, 2020 | Visits: 919
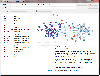 Graph visualization control for .NET. Mouse and keyboard controlled viewer, zoom, pan, select and hover events, fully customizable visual themes, built-in themes optimized for rendering quality and performance. *.gml file loader.
Free version allows usage in non commercial projects. Siplot...
Platforms: Windows 7, Windows
Graph visualization control for .NET. Mouse and keyboard controlled viewer, zoom, pan, select and hover events, fully customizable visual themes, built-in themes optimized for rendering quality and performance. *.gml file loader.
Free version allows usage in non commercial projects. Siplot...
Platforms: Windows 7, Windows
| License: Freeware | Size: 1.09 MB | Download (68): Siplot Graph Viewer Download |
Added: August 22, 2006 | Visits: 2.921
 GraphSight Junior is an easy to use freeware handy 2D math-graphing program. It was originally designed to help students and teachers satisfy their day-after-day math plotting needs. It makes it easy to plot and explore common Y(X) = F(X) Cartesian graphs, set text labels on the coordinate plane,...
Platforms: Windows
GraphSight Junior is an easy to use freeware handy 2D math-graphing program. It was originally designed to help students and teachers satisfy their day-after-day math plotting needs. It makes it easy to plot and explore common Y(X) = F(X) Cartesian graphs, set text labels on the coordinate plane,...
Platforms: Windows
| License: Freeware | Size: 393 KB | Download (726): GraphSight Junior Download |
Added: August 19, 2008 | Visits: 1.225
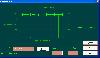
 Bar Graph MDI browses the web using GRML. GRML splits file and web page content into a form AND a view. The form is used for input controls, to handle user input for web requests. The view is used for display controls to show web page results. The results are dsplayed using 6 different graphs....
Platforms: Windows
Bar Graph MDI browses the web using GRML. GRML splits file and web page content into a form AND a view. The form is used for input controls, to handle user input for web requests. The view is used for display controls to show web page results. The results are dsplayed using 6 different graphs....
Platforms: Windows
| License: Freeware | Size: 1.31 MB | Download (126): Bar Graph MDI Download |
Added: August 03, 2008 | Visits: 2.363
 Graph A Ping allows you to graph the pings results of a host. To graphicly determing difference on latency response timers.
Platforms: Windows
Graph A Ping allows you to graph the pings results of a host. To graphicly determing difference on latency response timers.
Platforms: Windows
| License: Freeware | Size: 2 MB | Download (356): Graph A Ping Download |
Added: August 01, 2008 | Visits: 1.738
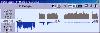 Traffic Graph is a network analytic tool that examines local area network usage and provides a display of upload and download statistics. The main puropse of the application is monitoring (and counting) the IP traffic between your local area network (LAN) and Internet.
Platforms: Windows
Traffic Graph is a network analytic tool that examines local area network usage and provides a display of upload and download statistics. The main puropse of the application is monitoring (and counting) the IP traffic between your local area network (LAN) and Internet.
Platforms: Windows
| License: Freeware | Size: 257 KB | Download (184): Traffic graph Download |
Added: August 30, 2008 | Visits: 6.959
Online Graph Applets include: Graph Polar Curves; Graph Rectangular; Graph Parametric Curves; Area Under Curve (Rect); Area Between Curves; Area Under Curve(Polar). Option to print is available.
Platforms: Any Browser + Java
| License: Freeware | Download (373): Online Graph Applets Download |
Added: August 01, 2008 | Visits: 1.576
Draws a graph from an algebraic formula entered by you, functions such as sine, cosine, tan, log, log natural and powers can be used. The x and y range displayed on the axis can be altered to zoom in and zoom out on the graph. Grid lines and value labels are displayed on the graph for easy...
Platforms: Windows
| License: Freeware | Size: 49 KB | Download (202): Roadkil's Graph Download |
Added: August 12, 2008 | Visits: 1.994
StatsEasy Regression allows you to compute linear equation from simple regression, you get the equation with slope and intercept, it draws the line graph and scatter diagram.
Platforms: Any Browser + Java
| License: Freeware | Download (738): StatsEasy Regression Download |
Added: August 02, 2008 | Visits: 2.540
StatsEasy Correlation is an online Java applet that allows you to compute the Coefficient of Correlation, it displays the results along with a scatter diagram and line graph. Some knowledge of statistics is required.
Platforms: Any Browser+Java
| License: Freeware | Download (785): StatsEasy Correlation Download |