


Customizable Plot freeware
Customizable Plot
Released: July 20, 2012
|
Added: July 20, 2012 | Visits: 567
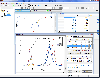 MagicPlot is a handy tool for scientific and engineer data processing, plotting and nonlinear fitting. MagicPlot is powerful enough and consistent.
Advantages
* Compact: Single file ~2 MB
* Multilevel undo function for all actions
* Useful plot navigation and scaling
* Visual nonlinear...
Platforms: All
MagicPlot is a handy tool for scientific and engineer data processing, plotting and nonlinear fitting. MagicPlot is powerful enough and consistent.
Advantages
* Compact: Single file ~2 MB
* Multilevel undo function for all actions
* Useful plot navigation and scaling
* Visual nonlinear...
Platforms: All
| License: Freeware | Size: 2.2 MB | Download (391): MagicPlot Student for Mac OS X Download |
Released: November 17, 2012
|
Added: November 17, 2012 | Visits: 497
 MagicPlot is a handy tool for scientific and engineer data processing, plotting and nonlinear fitting. MagicPlot is powerful enough and consistent.
Advantages
* Compact: Single file ~2 MB
* Multilevel undo function for all actions
* Useful plot navigation and scaling
* Visual nonlinear...
Platforms: All
MagicPlot is a handy tool for scientific and engineer data processing, plotting and nonlinear fitting. MagicPlot is powerful enough and consistent.
Advantages
* Compact: Single file ~2 MB
* Multilevel undo function for all actions
* Useful plot navigation and scaling
* Visual nonlinear...
Platforms: All
| License: Freeware | Size: 2.2 MB | Download (483): MagicPlot Student for Linux Download |
Released: August 26, 2012
|
Added: August 26, 2012 | Visits: 358
 MagicPlot 1.3.2, Bug fixing and minor update release, Dec 10, 2010
*
Added: Log10 scale
*
Added: 'Restore Auto Positioning' context menu item for manually positioned axes labels and legends
*
Added: Changing canvas size option: scale image or resize canvas only
*
Added: '% of Canvas...
Platforms: Windows, Mac
MagicPlot 1.3.2, Bug fixing and minor update release, Dec 10, 2010
*
Added: Log10 scale
*
Added: 'Restore Auto Positioning' context menu item for manually positioned axes labels and legends
*
Added: Changing canvas size option: scale image or resize canvas only
*
Added: '% of Canvas...
Platforms: Windows, Mac
| License: Freeware | Size: 2.2 MB | Download (442): MagicPlot Student Download |
Added: January 09, 2010 | Visits: 2.554
 Chart::Plot::Canvas is a Perl module to plot two dimensional data in an Tk Canvas. SYNOPSIS use Chart::Plot::Canvas; my $img = Chart::Plot::Canvas->new(); my $anotherImg = Chart::Plot::Canvas->new ($image_width, $image_height); $img->setData (@dataset) or die( $img->error() );...
Platforms: *nix
Chart::Plot::Canvas is a Perl module to plot two dimensional data in an Tk Canvas. SYNOPSIS use Chart::Plot::Canvas; my $img = Chart::Plot::Canvas->new(); my $anotherImg = Chart::Plot::Canvas->new ($image_width, $image_height); $img->setData (@dataset) or die( $img->error() );...
Platforms: *nix
| License: Freeware | Size: 5.12 KB | Download (162): Chart::Plot::Canvas Download |
Added: January 22, 2010 | Visits: 1.656
Chart::Plot is a Perl module to plot two dimensional data in an image. SYNOPSIS use Chart::Plot; my $img = Chart::Plot->new(); my $anotherImg = Chart::Plot->new ($image_width, $image_height); $img->setData (@dataset) or die( $img->error() ); $img->setData (@xdataset, @ydataset);...
Platforms: *nix
| License: Freeware | Size: 15.36 KB | Download (116): Chart::Plot Download |
Released: August 23, 2012
|
Added: August 23, 2012 | Visits: 709
Function Plot 2D is a small, simple, Java based application specially designed to help you create function plots.
Function Plot 2D lets you create a 2D plot, all you need to do is give an input function.
for WindowsAll
Platforms: Windows
| License: Freeware | Download (443): Function Plot 2D Download |
Released: August 23, 2012
|
Added: August 23, 2012 | Visits: 756
Function Plot 2D with Sections is a small, simple, Java based application specially designed to help you create function plots.
Function Plot 2D lets you create a 2D plot, all you need to do is give an input function.
for WindowsAll
Platforms: Windows
| License: Freeware | Download (449): Function Plot 2D with Sections Download |
Added: August 13, 2013 | Visits: 582
This function plot in the same figure the center trajectory and attitude of an aircraft. See the figure to understand better.The version 2.0, extend the functionality of version 1. In this version there are much more body models [for example the tomcat (see the figure), the shuttle, the mig,...
Platforms: Matlab
| License: Freeware | Size: 1.74 MB | Download (43): Trajectory and Attitude Plot Version 2 Download |
Added: April 12, 2013 | Visits: 622
Syntax: plotdata; plotdata(hPlotFig); plotdata(figureName,sheetName,xdata,ydata, xAxisName,yHeaders,...); [hDataFig, hSpreadsheet] = plotdata(...); PLOTDATA(hPlotFig) scans the supplied figure handle for any plot axes; for each plot axes found, a new spreadsheet is created with the plot data...
Platforms: Matlab
| License: Freeware | Size: 40.96 KB | Download (46): PlotData - display plot raw-data in data-tables Download |
Added: April 14, 2013 | Visits: 592
I wrote this to plot some overlapping data sets with there means and regions of +/- std deviations shown. It could be used for other purposes though.
Platforms: Matlab
| License: Freeware | Size: 10 KB | Download (47): Plot Overlapping Regions With Lines Download |
Added: January 09, 2010 | Visits: 776
Xastir ptoject can receive and plot APRS position packets. Development is a collaborative effort of programmers from around the world. Xastir supports many map formats and is highly customizable. Check out the "Screen Shots" link to see just a few of the ways that Xastir can be used. Xastir...
Platforms: *nix
| License: Freeware | Size: 2.1 MB | Download (96): Xastir Download |
Released: August 24, 2012
|
Added: August 24, 2012 | Visits: 561
 Coulson Plot Generator application creates a multiple pie diagram, for comparing subunit occupancy across a range of entities. Numbers of pies, segments, labels and colours are customisable. Creates an editable PDF from a comma separated text file.
Platforms: Windows, Mac, Solaris, Linux
Coulson Plot Generator application creates a multiple pie diagram, for comparing subunit occupancy across a range of entities. Numbers of pies, segments, labels and colours are customisable. Creates an editable PDF from a comma separated text file.
Platforms: Windows, Mac, Solaris, Linux
| License: Freeware | Size: 150.49 KB | Download (48): Coulson Plot Generator Download |
Added: September 10, 2013 | Visits: 480
Plot Digitizer is a Java program used to digitize scanned plots of functional data. Often data is found presented in reports and references as functional X-Y type scatter or line plots. In order to use this data, it must somehow be digitized. This program will allow you to take a scanned image of...
Platforms: Mac
| License: Freeware | Size: 1.16 MB | Download (47): Plot Digitizer Download |
Released: June 18, 2012
|
Added: June 18, 2012 | Visits: 349
Portable Plot is a pure ansi/iso c++ plot library that makes the construction of native plot widgets easy.
Platforms: Windows, Mac, Linux
| License: Freeware | Size: 456.67 KB | Download (45): portable plot Download |
Added: July 11, 2013 | Visits: 477
The available function to draw the Nyquist plot doesn't give the proper image of function. So here is the code to get the clear image.
Platforms: Matlab
| License: Freeware | Size: 10 KB | Download (43): Matlab, Nyquist, Power system, Plots, Nyquist plot. Download |
Added: July 11, 2013 | Visits: 451
The script plots the envelope of the bode plot for a parametric uncertain/interval system.interval_bode(NumVec,DenVec,clr)The function accepts the numerator (NumVec) and denominator (DenVec) of the uncertain system as matrices of two rows each. The first row containing the lower bounds and the...
Platforms: Matlab
| License: Freeware | Size: 10 KB | Download (43): Interval Bode Plot Download |
Added: March 27, 2013 | Visits: 469
This function makes an imagesc-like plot for two matrices with equal dimensions, in which each each cell of the plot is split diagonally with the upper triangle of cell (i,j) in the plot representing the Matrix1(i,j) and the lower triangle representing Matrix2(i,j).
Platforms: Matlab
| License: Freeware | Size: 10 KB | Download (43): Overlay 2 matrices in an imagesc-like plot Download |
Added: June 21, 2013 | Visits: 507
You have to give it the coordinates of the ends, number of coils, natural length and radius and it gives to you the (xs,ys) coordinates of the spring points, ready to use it with plot(). The picture shows an instant image of an animation of two coupled-pendulums oscillating Type for usage. Don't...
Platforms: Matlab
| License: Freeware | Size: 10 KB | Download (43): Spring() To plot and animate a 2D-Spring Download |
Added: May 16, 2013 | Visits: 450
This function plot in the same figure the center trajectory and attitude of an aircraft. See the figure to understand better.The version 3.0, extend the functionality of version 2.In this last version :- fixed the Reference System Bugs- possibility to export the trajectory animation in avi format...
Platforms: Matlab
| License: Freeware | Size: 10 KB | Download (46): Trajectory and Attitude Plot Version 3 Download |
Added: March 28, 2013 | Visits: 449
Plot earth in 3D sphereSeveral maps and resolutions are availableMore comprehensive map collection is available athttp://www.mediafire.com/?m2mn1mgdngt
Platforms: Matlab
| License: Freeware | Size: 17.82 MB | Download (43): Plot earth Download |