


Acad Scale X Y freeware
Acad Scale X Y
Added: August 19, 2013 | Visits: 564
 D = DISTMAT(X,Y) for matrices X and Y returns the distance matrix where the (i,j)th entry is the d-norm distance between the ith and jth row of X and Y respectively.DISTMAT(X,Y,d) computes a specific d-norm distance. Default=2[D,XI,YI]=DISTMAT(X,Y,d,var) gives the indices of the sorted values of...
Platforms: Matlab
D = DISTMAT(X,Y) for matrices X and Y returns the distance matrix where the (i,j)th entry is the d-norm distance between the ith and jth row of X and Y respectively.DISTMAT(X,Y,d) computes a specific d-norm distance. Default=2[D,XI,YI]=DISTMAT(X,Y,d,var) gives the indices of the sorted values of...
Platforms: Matlab
| License: Freeware | Size: 10 KB | Download (47): distmat Download |
Added: May 18, 2013 | Visits: 423
Most ROI Drawing Tools limit you to either drawing a circular ROI or a rectangular ROI perpendicular to the X-Y axis. ROI Draw's primary purpose is to expand upon the drawing of rectangular ROI's by allowing you to draw them at any angle.After selection of an ROI, ROI Draw crops and rotates your...
Platforms: Matlab
| License: Freeware | Size: 20.48 KB | Download (46): ROI Draw Download |
Added: May 29, 2013 | Visits: 437
[M,B] = AG_RECTA(X,Y) finds the the slope M and the y-intercept B of the line that better fits to the X,Y data. X and Y are vectors of the same length.
Platforms: Matlab
| License: Freeware | Size: 10 KB | Download (43): Straight-line fitting genetic algorithm Download |
Added: April 28, 2013 | Visits: 483
MINimal CONNECTivity (adjacency) matrix for (X,Y) points on a plane, and/or graph of connections. Needs CLINE.Applications: graph theory, optimal traffic, astronomy (e.g. if youwant to see a tree of connected stars selected according to certain bounds on distance and/or magnitude etc).The...
Platforms: Matlab
| License: Freeware | Size: 10 KB | Download (43): MINCONNECT Download |
Added: April 12, 2013 | Visits: 623
Syntax: plotdata; plotdata(hPlotFig); plotdata(figureName,sheetName,xdata,ydata, xAxisName,yHeaders,...); [hDataFig, hSpreadsheet] = plotdata(...); PLOTDATA(hPlotFig) scans the supplied figure handle for any plot axes; for each plot axes found, a new spreadsheet is created with the plot data...
Platforms: Matlab
| License: Freeware | Size: 40.96 KB | Download (46): PlotData - display plot raw-data in data-tables Download |
Added: July 26, 2013 | Visits: 559
a function to define the coordination of your own subplot axesyou'd better estimate the input to assure not exceed the figure;this function is similar to the subplot(row,col,i)i is the ith subplot[x,y,w,h]=MYaxis(rownum,colnum,wblank,hblank,leftside,rightside,upside,downside,i); rownum=5 colnum=4...
Platforms: Matlab
| License: Freeware | Size: 10 KB | Download (45): MYaxis Download |
Added: March 25, 2013 | Visits: 374
GRDWRITE2(X,Y,Z,'file.grd') will create a grid file containing the data in the matrix Z. X and Y should be either vectors with dimensions that match the size of Z or two-component vectors containing the max and min values for each. The file will be a COARDS-compliant NetCDF file, the standard...
Platforms: Matlab
| License: Freeware | Size: 10 KB | Download (49): grdwrite2 Download |
Added: June 14, 2013 | Visits: 364
Conversion routines to take a surface (a function z of (x,y) or (theta,r)) and convert this into a solid; much as meshz does, but a little more useful for outputting as an STL for frabrication in a 3D printer. There are two cases, one in Cartesian co-ordinates, and the other in polar...
Platforms: Matlab
| License: Freeware | Size: 10 KB | Download (43): surf2solid Download |
Released: January 15, 2022
|
Added: February 29, 2024 | Visits: 3.542
 Transparency. Privacy protection. and Participation. our values.
Revolution.
Pirate Desire can project any kind of calculation in x / y / t, and it can integrate over time. Select your Target. Check your Options. Build your own Ship. contribute. and grow. be successful. Vote....
Platforms: Windows, Windows 8, Windows 7, Windows Server
Transparency. Privacy protection. and Participation. our values.
Revolution.
Pirate Desire can project any kind of calculation in x / y / t, and it can integrate over time. Select your Target. Check your Options. Build your own Ship. contribute. and grow. be successful. Vote....
Platforms: Windows, Windows 8, Windows 7, Windows Server
| License: Freeware | Size: 6.06 MB | Download (1014): Pirate Desire Download |
Added: March 23, 2010 | Visits: 1.261
SDL::Video is a SDL perl extension. SYNOPSIS $video = new SDL::Video ( -name => pr0n.mpg ); SDL::Video adds support for MPEG video to your SDL Perl application. Videos are objects bound to surfaces, whose playback is controled through the objects interface. METHODS SDL::Video::error()...
Platforms: *nix
| License: Freeware | Size: 778.24 KB | Download (109): SDL::Video Download |
Added: June 07, 2010 | Visits: 1.079
PDL::Graphics::X is a PDL OO access to X windows. SYNOPSIS # example 1 use PDL; use PDL::Graphics::X; my $x_size = 255; my $y_size = 255; my $win1 = PDL::Graphics::X->new({SIZE_X => $x_size, SIZE_Y => $y_size}); my $a = xvals(zeroes(byte,$x_size,$y_size)); $win1->imag($a); # example...
Platforms: *nix
| License: Freeware | Size: 10.24 KB | Download (106): PDL::Graphics::X Download |
Added: August 03, 2010 | Visits: 1.252
PDL::Graphics::AquaTerm is a Perl module that provides access to the AquaTerm Mac OS-X graphics terminal. SYNOPSIS # example 1 use PDL; use PDL::Graphics::LUT; use PDL::Graphics::AquaTerm; my $x_size = 255; my $y_size = 255; aquaOpen({SIZE_X => $x_size, SIZE_Y => $y_size});...
Platforms: *nix
| License: Freeware | Size: 8.19 KB | Download (93): PDL::Graphics::AquaTerm Download |
Released: August 08, 2012
|
Added: August 08, 2012 | Visits: 475
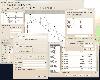 Veusz is a GUI scientific plotting and graphing package. It is designed to produce publication-ready Postscript or PDF output. SVG, EMF and bitmap export formats are also supported. The program runs under Unix/Linux, Windows or Mac OS X, and binaries are provided. Data can be read from text, CSV...
Platforms: Mac
Veusz is a GUI scientific plotting and graphing package. It is designed to produce publication-ready Postscript or PDF output. SVG, EMF and bitmap export formats are also supported. The program runs under Unix/Linux, Windows or Mac OS X, and binaries are provided. Data can be read from text, CSV...
Platforms: Mac
| License: Freeware | Size: 10.2 MB | Download (432): Veusz for Mac OS X Download |
Added: April 20, 2013 | Visits: 381
y = RankOrderFilter(x, window, thd) runs a rank-order filtering of order N on x. y is the same size as x. If x is a matrix, RankOrderFilter operates along the columns of x.Rank-order filter calculates the p'th percentile of the data on an N sized window round each point of x. p can be a number...
Platforms: Matlab
| License: Freeware | Size: 10 KB | Download (53): Rank-Order Filter Download |
Added: July 07, 2013 | Visits: 479
function P=ipeak(DataMatrix,PeakD,AmpT,SlopeT,SmoothW,FitW)Keyboard-operated Interactive Peak Finder for data in data matrix "DataMatrix", with x values in row 1 and y values in row 2. Returns the peak table in P (Peak #, Position, Height, Width.) See...
Platforms: Matlab
| License: Freeware | Size: 10 KB | Download (43): iPeak: Interactive Peak Detector Download |
Added: May 26, 2013 | Visits: 461
DISTMATLATLON Computes distance matrix between list of coords in X and Y D = DISTMATLATLON(X,Y) for matrices X and Y, with columns [Lat Lon], returns the distance matrix where the (i,j)th entry is the distance between the i'th and j'th row of X and Y respectively. X and Y must have columns in the...
Platforms: Matlab
| License: Freeware | Size: 10 KB | Download (46): Distance Matrix Latitude Longitude Download |
Added: May 29, 2013 | Visits: 452
multiwaveplot(WAVE) draws a series of stacked waves (one on top of the other) contained in the rows of WAVE. Each wave has a designated row on the plot; the first row is plotted at the bottom of the plot.multiwaveplot(X,Y,WAVE) draws a series of wave centred on each element of Y, with x-data...
Platforms: Matlab
| License: Freeware | Size: 10 KB | Download (43): Multichannel Wave Plotting Download |
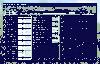
Added: August 20, 2008 | Visits: 1.659
With this FREE AutoCAD add-on you can create terrain sectionsfrom geodetic points(heights) in the drawing. You can alsospecify position of pipe(cable, road, ...) or set auxiliarymarks in the section. Text settings, scale in X,Y axis, height of the referenceplane and type of the terrain section...
Platforms: Windows
| License: Freeware | Size: 69 KB | Download (705): TerrainSectionsPro2X Download |
Added: January 18, 2010 | Visits: 2.272
Chart::Graph::Gnuplot is a function in module Chart::Graph that lets you generate graphs on the fly in perl. SYNOPSIS use Chart::Graph::Gnuplot qw(&gnuplot); gnuplot(%global_options, [%data_set_options, @matrix], [%data_set_options, @x_column, @y_column], [%data_set_options, < filename...
Platforms: *nix
| License: Freeware | Size: 8.19 KB | Download (173): Chart::Graph::Gnuplot Download |
Added: February 18, 2010 | Visits: 1.046
PDL::GSL::INTERP is a PDL interface to Interpolation routines in GSL. SYNOPSIS use PDL; use PDL::GSL::INTERP; my $x = sequence(10); my $y = exp($x); my $spl = PDL::GSL::INTERP->init(cspline,$x,$y); my $res = $spl->eval(4.35); $res = $spl->deriv(4.35); $res = $spl->deriv2(4.35);...
Platforms: *nix
| License: Freeware | Size: 2.1 MB | Download (93): PDL::GSL::INTERP Download |