


Scatter Graphs software
Scatter Graphs
Released: January 19, 2013
|
Added: January 19, 2013 | Visits: 659
 Add Powerful reporting features to your Web / Intranet pages and applications. With advanced graphing you will be quickly adding impressive and dynamic charting capabilities bringing your data alive ! The PHP graphing scripts provide a very easy way to embed dynamically generated graphs and...
Platforms: Windows, Mac, Unix, Linux, Linux Console, Linux Gnome, Linux GPL, Linux Open Source
Add Powerful reporting features to your Web / Intranet pages and applications. With advanced graphing you will be quickly adding impressive and dynamic charting capabilities bringing your data alive ! The PHP graphing scripts provide a very easy way to embed dynamically generated graphs and...
Platforms: Windows, Mac, Unix, Linux, Linux Console, Linux Gnome, Linux GPL, Linux Open Source
| License: Shareware | Cost: $195.00 USD | Size: 958 KB | Download (51): Advanced Dynamic Graphs and Charts PHP Download |
Released: January 11, 2013
|
Added: January 11, 2013 | Visits: 469
 Graphs is a handy graphing add-on you can use with SharePoint. It supports both line graphs and pie charts and is capable of directly connecting to SharePoint lists. Easy-to-use visualization web part that can connect directly to your list data. And the best thing - it's free!!
FEATURES:
·...
Platforms: Windows
Graphs is a handy graphing add-on you can use with SharePoint. It supports both line graphs and pie charts and is capable of directly connecting to SharePoint lists. Easy-to-use visualization web part that can connect directly to your list data. And the best thing - it's free!!
FEATURES:
·...
Platforms: Windows
| License: Freeware | Size: 369 KB | Download (57): Graphs Download |
Released: November 07, 2012
|
Added: November 07, 2012 | Visits: 353
 gxlbrowse is a simple utility that reads graphs in the GraphViz XML format (GXL) and presents them in an interactive browser.
Platforms: Windows, Mac, Linux
gxlbrowse is a simple utility that reads graphs in the GraphViz XML format (GXL) and presents them in an interactive browser.
Platforms: Windows, Mac, Linux
| License: Freeware | Size: 218 KB | Download (45): gxlbrowse - interactive graphviz graphs Download |
Released: June 27, 2012
|
Added: June 27, 2012 | Visits: 418
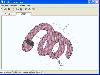
 The Visualization of Protein-Ligand Graphs (VPLG) software package computes and visualizes protein graphs. It works on the super-secondary structure level and uses the atom coordinates from PDB files and the SSE assignments of the DSSP algorithm.
Platforms: Windows, Mac, BSD, Linux
The Visualization of Protein-Ligand Graphs (VPLG) software package computes and visualizes protein graphs. It works on the super-secondary structure level and uses the atom coordinates from PDB files and the SSE assignments of the DSSP algorithm.
Platforms: Windows, Mac, BSD, Linux
| License: Freeware | Size: 6.6 MB | Download (46): Visualization of Protein-Ligand Graphs Download |
Added: May 10, 2013 | Visits: 283
The os.path.walk routine that ships with the python standard library is limited to traversing the file system tree. This script allows you to realize a generic traversal for arbitrary (directed) graphs with support for recursion limits.
Platforms: Windows, Mac, *nix, Python, BSD Solaris
| License: Freeware | Download (50): Lazy Traversal of Directed Graphs Download |
Added: July 30, 2013 | Visits: 405
This script takes advantage of Matlabs links with Photoshop to create a 2d transparent scatter plot of your data, which, I believe is not possible at present in Matlab. Although rasterization is not ideal, you can specify any image size in pixels (and point size) with this function. You can also...
Platforms: Matlab
| License: Shareware | Cost: $0.00 USD | Size: 10 KB | Download (46): PhotoShop Scatter Download |
Added: April 25, 2013 | Visits: 441
A very easy symbolic method for reduction of block diagrams or signal flow graphs with Matlab is presented. The method can be applied to every kind of diagram and it is possible to obtain in one stage all transfer functions for a given input. The method is validated with some examples, including...
Platforms: Matlab
| License: Shareware | Cost: $0.00 USD | Size: 122.88 KB | Download (44): Symbolic reduction of block diagrams and signal flow graphs Download |
Added: May 15, 2013 | Visits: 437
Like Matlab's scatter command, lscatter produces a scatter plot. Unlike scatter, it allows you to also use a vector of labels that are used instead of the usual uniform markers. lscatter(x,y,l)generates a scatter plot where label{i} is placed at the coordinate (x(i),y(i)), for all i.The program...
Platforms: Matlab
| License: Shareware | Cost: $0.00 USD | Size: 10 KB | Download (43): lscatter : scatter plot with labels instead of markers Download |
Added: July 15, 2013 | Visits: 309
Producing scatter plots can be quite memory and computationally intensive using the built-in Scatter command. This simple routine produces scatter plots by binning the range of values used to define the associated colour and mapping this to a user defined colour map. The file was deliberately...
Platforms: Matlab
| License: Shareware | Cost: $0.00 USD | Size: 10 KB | Download (44): Quick Scatter Download |
Added: July 08, 2013 | Visits: 419
The note describes a simple m-file for digitizing graphs in the form of bitmap images using the Matlab ginput mouse pointer.Axes are allowed to be skewed, as well as linear and/or logarithmic.
Platforms: Matlab
| License: Shareware | Cost: $0.00 USD | Size: 61.44 KB | Download (48): Digitizing Graphs Download |
Added: March 26, 2013 | Visits: 484
The SumProductLab provides a set of basic factor nodes for building up a factor graph. One can try out ideas by instantiating the necessary constraint nodes, connecting them up, and giving some evidence. The sum-product (or belief propagation) algorithm will compute the message to each node in...
Platforms: Matlab
| License: Shareware | Cost: $0.00 USD | Size: 829.44 KB | Download (45): SumProductLab for Factor Graphs Download |
Added: June 29, 2013 | Visits: 362
For analysing measurements (or simulations) it is often necessary to plot different graphs from an array of data. Some graphs have one line, other have more.PLOTMAT is a function to do this. Given an array of data, and an array for which columns have to be plotted in which graphs, the graphs are...
Platforms: Matlab
| License: Shareware | Cost: $0.00 USD | Size: 10 KB | Download (39): Plot different graphs at once Download |
Added: January 01, 2006 | Visits: 7.937
 3D Grapher is a feature-rich yet easy-to-use graph plotting and data visualization software suitable for students, engineers and everybody who needs to work with 2D and 3D graphs. With 3D Grapher you can easily plot the equation and table-based graphs, zoom them, rotate, view at any angle and...
Platforms: Windows
3D Grapher is a feature-rich yet easy-to-use graph plotting and data visualization software suitable for students, engineers and everybody who needs to work with 2D and 3D graphs. With 3D Grapher you can easily plot the equation and table-based graphs, zoom them, rotate, view at any angle and...
Platforms: Windows
| License: Shareware | Cost: $24.95 USD | Size: 728 KB | Download (942): 3D Grapher Download |
Released: March 09, 2009
|
Added: August 15, 2014 | Visits: 6.354
 Powerful but easy-to-use graphing, curve fitting and calculating software. Graphs Cartesian (Y(x) and X(y)), polar and parametric functions, graphs of tables, equations (implicit functions), inequalities and slope fields. Up to 100 graphs in one window. Calculus features: regression analysis,...
Platforms: Windows
Powerful but easy-to-use graphing, curve fitting and calculating software. Graphs Cartesian (Y(x) and X(y)), polar and parametric functions, graphs of tables, equations (implicit functions), inequalities and slope fields. Up to 100 graphs in one window. Calculus features: regression analysis,...
Platforms: Windows
| License: Shareware | Cost: $29.95 USD | Size: 1.38 MB | Download (704): Advanced Grapher Download |
Added: April 04, 2006 | Visits: 7.200
TaskMeter lets you put your CPU usage graph right on your taskbar. You can also measure a wide variety of other things, including disk access, network access, context switches, memory usage, and many more. Anything you can monitor in performance monitor (perfmon), you can monitor in TaskMeter....
Platforms: Windows
| License: Shareware | Cost: $15.00 USD | Size: 1000 KB | Download (401): TaskMeter Download |
Released: May 06, 2006
|
Added: November 28, 2007 | Visits: 3.501
 ActiveX/OCX control to draw 2D pie charts, bar charts & line graphs. As well as displaying the graphs they can be exported to file in gif, png, bmp, jpg or pcx format. Output can be exported as binary data for use with web applications, or copied to the clipboard. A comprehensive selection of...
Platforms: Windows
ActiveX/OCX control to draw 2D pie charts, bar charts & line graphs. As well as displaying the graphs they can be exported to file in gif, png, bmp, jpg or pcx format. Output can be exported as binary data for use with web applications, or copied to the clipboard. A comprehensive selection of...
Platforms: Windows
| License: Shareware | Cost: $60.00 USD | Size: 976.33 KB | Download (176): csXGraph Download |
Released: January 07, 2003
|
Added: November 22, 2006 | Visits: 3.268
 Web Enabled solution for creating Stacked Horizontal Charts & Graphs. Versatile components for web authors and developers to easily build and publish dynamic and interactive bar graphs.
Database Access Methods (Direct Data Binding and Multi-Tier)
Template Scripts and Implementations (ASP,...
Platforms: DOS, Windows, Mac, *nix, Windows CE
Web Enabled solution for creating Stacked Horizontal Charts & Graphs. Versatile components for web authors and developers to easily build and publish dynamic and interactive bar graphs.
Database Access Methods (Direct Data Binding and Multi-Tier)
Template Scripts and Implementations (ASP,...
Platforms: DOS, Windows, Mac, *nix, Windows CE
| License: Shareware | Cost: $49.95 USD | Size: 259 KB | Download (722): 3D Stacked Horizontal Bar Graph Software Download |
Released: August 01, 2006
|
Added: November 06, 2006 | Visits: 4.859
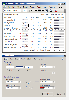
 EasyFit allows to easily and quickly select the probability distribution which best fits to data, reducing your analysis times by 70-95% over manual methods. It includes numerous features designed to save you time, prevent analysis errors, and help you make better decisions.
An integrated...
Platforms: Windows
EasyFit allows to easily and quickly select the probability distribution which best fits to data, reducing your analysis times by 70-95% over manual methods. It includes numerous features designed to save you time, prevent analysis errors, and help you make better decisions.
An integrated...
Platforms: Windows
| License: Shareware | Cost: $299.00 USD | Size: 2.08 MB | Download (315): EasyFit Download |
Released: January 12, 2005
|
Added: June 26, 2006 | Visits: 2.413
 Archim is a program for drawing the graphs of all kinds of functions. You can define a graph explicitly and parametrically, in polar and spherical coordinates, on a plane and in space (surface). Archim will be useful for teachers and students, as well as for everyone who is interested min...
Platforms: Windows
Archim is a program for drawing the graphs of all kinds of functions. You can define a graph explicitly and parametrically, in polar and spherical coordinates, on a plane and in space (surface). Archim will be useful for teachers and students, as well as for everyone who is interested min...
Platforms: Windows
| License: Shareware | Cost: $25.00 USD | Size: 648 KB | Download (161): Archim Download |
Released: October 20, 2006
|
Added: November 17, 2006 | Visits: 3.422
 MicroCharts delivers an intuitive Excel add-in allowing you to create richer, more concise reports and dashboards with more information per square inch. Using the latest techniques in dashboard reporting, MicroCharts helps you generate data-rich tables and graphs as small as the size of words....
Platforms: Windows
MicroCharts delivers an intuitive Excel add-in allowing you to create richer, more concise reports and dashboards with more information per square inch. Using the latest techniques in dashboard reporting, MicroCharts helps you generate data-rich tables and graphs as small as the size of words....
Platforms: Windows
| License: Shareware | Cost: $49.00 USD | Size: 488 KB | Download (179): MicroCharts Download |