


Plotting software
Plotting
Released: August 19, 2012
|
Added: August 19, 2012 | Visits: 396
 The Plot.py project tries to supply an easy to use measurement data visualization and treatment framework being easy to use while keeping the freedom for advanced users to execute additional data treatment algorithms. The program is build on a object oriented modular basis to provide the...
Platforms: Linux
| License: Freeware | Download (441): Plotting GUI for Linux Download |
Released: November 26, 2012
|
Added: November 26, 2012 | Visits: 379
The Plot.py project tries to supply an easy to use measurement data visualization and treatment framework being easy to use while keeping the freedom for advanced users to execute additional data treatment algorithms. The program is build on a object oriented modular basis to provide the...
Platforms: Windows
| License: Freeware | Size: 41.9 MB | Download (503): Plotting GUI Download |
Released: October 08, 2012
|
Added: October 08, 2012 | Visits: 522
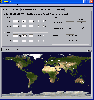 GreatCirc is a tool for calculating Great Circle distances on the earth's surface, and plotting points and great circle paths on a world map.
The "great circle path" is the shortest direct route between two points on the earth's surface. Because the earth is a globe, the shortest path between...
GreatCirc is a tool for calculating Great Circle distances on the earth's surface, and plotting points and great circle paths on a world map.
The "great circle path" is the shortest direct route between two points on the earth's surface. Because the earth is a globe, the shortest path between...
Platforms: Windows
| License: Freeware | Size: 2.2 MB | Download (455): GreatCirc Download |
Released: September 04, 2012
|
Added: September 04, 2012 | Visits: 561
 DataFit is a tool used to perform nonlinear regression (curve fitting), statistical analysis and data plotting. What sets DataFit apart from similar curve fitting and regression programs is its ease of use. DataFit is driven by a well-designed graphical interface, so there are no complicated...
Platforms: Windows
| License: Shareware | Cost: $249.00 USD | Size: 7.34 MB | Download (61): DataFit Download |
Released: November 19, 2012
|
Added: November 19, 2012 | Visits: 341
 The Plot.py project tries to supply an easy to use measurement data visualization and treatment framework being easy to use while keeping the freedom for advanced users to execute additional data treatment algorithms. The program is build on a object oriented modular basis to provide the...
Platforms: Linux
| License: Freeware | Size: 850 KB | Download (485): Plotting GUI for Linux 0.7.13 Beta Download |
Added: May 10, 2013 | Visits: 390
matplotlib is a python 2D plotting library which produces publication quality figures in a variety of hardcopy formats and interactive environments across platforms. matplotlib can be used in python scripts, the python and ipython shell (ala matlab or mathematica), web application servers, and...
Platforms: Windows, Mac, *nix, Python, BSD Solaris
| License: Freeware | Download (49): Matplotlib Download |
Added: May 10, 2013 | Visits: 539
PlotKit is a Chart and Graph Plotting Library for Javascript. It has support for HTML Canvas and also SVG via Adobe SVG Viewer and native browser support. PlotKit is fully documented and there is also a quick tutorial to get you started. PlotKit is a complete rewrite of CanvasGraph. It is better...
Platforms: Windows, Mac, *nix, JavaScript, BSD Solaris
| License: Freeware | Download (65): PlotKit Download |
Added: August 22, 2013 | Visits: 419
The function plotting figure inside figure (main and inset) from 2 existing figures.
Platforms: JavaScript
| License: Shareware | Cost: $0.00 USD | Size: 10 KB | Download (45): figure inset Download |
Added: May 15, 2013 | Visits: 466
There are 23 different functions performing basic orbital operations (Hohmann tx, inclination and node changes, orbital parameter conversions, ground tracks, orbit plotting, etc.). Some of these functions are still rough, so please provide feedback. These functions are basically how I did all of...
Platforms: Matlab
| License: Freeware | Size: 573.44 KB | Download (46): Orbital Mechanics Library Download |
Added: March 23, 2013 | Visits: 479
A Simple Pack of Tools for Plotting Lattices and Crystals and Calculating Their Properties. Description is in each file.
Platforms: Matlab
| License: Freeware | Size: 102.4 KB | Download (46): Solid State Physics Simulation Pack Download |
Added: August 01, 2013 | Visits: 427
These routines allow easy plotting of lines or contours with hatches on one side. This line style is often used to represent a constraint, where one side of the line represents a no-go area.
Platforms: Matlab
| License: Freeware | Size: 10 KB | Download (39): Hatched Lines and Contours Download |
Added: April 24, 2013 | Visits: 535
From undergraduate chemistry, we know how to test whether a reaction is 0th, 1st, or 2nd order by plotting different transformations of the data, and inspecting which plot fits the best.This program does the same thing. It transforms the data using different values of the order, attempting to...
Platforms: Matlab
| License: Freeware | Size: 10 KB | Download (40): orderseek - Finds chemical reaction order Download |
Added: May 01, 2013 | Visits: 353
Maple is a great tool for symbolic manipulation and is also very smart at plotting expressions, handling discontinuities,etc.However the plot customization and export possibilities are very primitive. Also, often I want to superimpose Maple plots with other data. This is very clumsy to handle in...
Platforms: Matlab
| License: Freeware | Size: 10 KB | Download (47): ReadMaplePlot Download |
Added: September 03, 2013 | Visits: 360
SimDriver enables Matlab users to scan local M-files to detect simulation parameters and results in order to automize related sensitivity analysis and plotting via dedicated GUI .SimDriver delivery embeds on-line help and training example .SimDriver download comes with a one year license .
Platforms: Matlab
| License: Freeware | Size: 10 KB | Download (41): SimDriver Download |
Added: June 28, 2013 | Visits: 394
function [h1, h2] = plot_dir3 (vX, vY, vZ) Plotting x-y-z variables with direction indicating vector to the next element. Example vX = linspace(0,2*pi, 10)'; vY = sin (vX); vZ = cos (vX); plot_dir3(vX, vY, vZ);
Platforms: Matlab
| License: Shareware | Cost: $0.00 USD | Size: 10 KB | Download (41): Plot With Direction 3D Download |
Added: May 23, 2013 | Visits: 294
No plotting utilities are included. You can use this submission for reading and related submissions for plotting.
Platforms: Matlab
| License: Shareware | Cost: $0.00 USD | Size: 512 KB | Download (42): read_teqc_compact Download |
Added: June 07, 2013 | Visits: 453
A simple gui design shows the ability to make dynamic plotting by changing the value of slider which produce a change in the circle radius.
Platforms: Matlab
| License: Shareware | Cost: $0.00 USD | Size: 10 KB | Download (49): Resize a circle using slider by gui Download |
Added: June 08, 2013 | Visits: 384
The function plotting 3-dimensional lines (or pathes) as pipes.
Platforms: Matlab
| License: Shareware | Cost: $0.00 USD | Size: 10 KB | Download (49): pipe_plot Download |
Added: September 04, 2013 | Visits: 635
ykcee is an easy-to-use highly configurable chart plotting php class.Right at the moment ykcee can do bars, lines, areas, linepoints, dots and pie-charts. The complete layout is highly configurable.
Platforms: PHP
| License: Freeware | Size: 225.28 KB | Download (44): ykcee for Scripts Download |
Added: August 12, 2013 | Visits: 256
Core Plot is a plotting framework for Mac OS X and iOS. It provides 2D visualization of data, and is tightly integrated with Apple technologies like Core Animation, Core Data, and Cocoa Bindings.
Platforms: Mac
| License: Freeware | Size: 9.57 MB | Download (40): Core Plot Download |