


Plot Ellipse software
Plot Ellipse
Added: July 20, 2013 | Visits: 210
 It is common to find routines to plot ellipses without the ellipse phase angle parameter.Phase angle provides important information in many applications...This function also allows ellipse to be drawn at different z levels.Three ways to show ellipse phase is shown in the...
Platforms: Matlab
It is common to find routines to plot ellipses without the ellipse phase angle parameter.Phase angle provides important information in many applications...This function also allows ellipse to be drawn at different z levels.Three ways to show ellipse phase is shown in the...
Platforms: Matlab
| License: Shareware | Cost: $0.00 USD | Size: 10 KB | Download (51): plot_ellipse Download |
Added: March 22, 2006 | Visits: 3.138
Plot Observer is an AutoCAD add-on utility that silently records all print/plot activity in AutoCAD. Plot Observer records billing information, page size/sqaure footage, plotter name, and user information for each print/plot run in AutoCAD. Plot Observer records data in a central log file for...
Platforms: Windows
| License: Shareware | Cost: $120.00 USD | Size: 3.32 MB | Download (169): Plot Observer Download |
Added: January 09, 2010 | Visits: 2.554
Chart::Plot::Canvas is a Perl module to plot two dimensional data in an Tk Canvas. SYNOPSIS use Chart::Plot::Canvas; my $img = Chart::Plot::Canvas->new(); my $anotherImg = Chart::Plot::Canvas->new ($image_width, $image_height); $img->setData (@dataset) or die( $img->error() );...
Platforms: *nix
| License: Freeware | Size: 5.12 KB | Download (162): Chart::Plot::Canvas Download |
Added: January 22, 2010 | Visits: 1.658
Chart::Plot is a Perl module to plot two dimensional data in an image. SYNOPSIS use Chart::Plot; my $img = Chart::Plot->new(); my $anotherImg = Chart::Plot->new ($image_width, $image_height); $img->setData (@dataset) or die( $img->error() ); $img->setData (@xdataset, @ydataset);...
Platforms: *nix
| License: Freeware | Size: 15.36 KB | Download (116): Chart::Plot Download |
Released: August 23, 2012
|
Added: August 23, 2012 | Visits: 709
Function Plot 2D is a small, simple, Java based application specially designed to help you create function plots.
Function Plot 2D lets you create a 2D plot, all you need to do is give an input function.
for WindowsAll
Platforms: Windows
| License: Freeware | Download (443): Function Plot 2D Download |
Released: August 23, 2012
|
Added: August 23, 2012 | Visits: 756
Function Plot 2D with Sections is a small, simple, Java based application specially designed to help you create function plots.
Function Plot 2D lets you create a 2D plot, all you need to do is give an input function.
for WindowsAll
Platforms: Windows
| License: Freeware | Download (449): Function Plot 2D with Sections Download |
Added: May 03, 2013 | Visits: 470
This is a fast non-iterative ellipse fit, and among fast non-iterative ellipse fits this is the most accurate and robust.It takes the xy-coordinates of data points, and returns the coefficients of the equation of the ellipse: ax^2 + bxy + cy^2 + dx + ey + f = 0,i.e. it returns the vector...
Platforms: Matlab
| License: Freeware | Size: 10 KB | Download (50): Ellipse Fit (Taubin method) Download |
Added: September 02, 2013 | Visits: 411
This is a fast and non-iterative ellipse fit. Usage: A = EllipseDirectFit(XY)Input: XY(n,2) is the array of coordinates of n points x(i)=XY(i,1), y(i)=XY(i,2) Output: A = [a b c d e f]' is the vector of coefficients of the equation of the best fitting ellipse: ax^2 + bxy + cy^2 + dx + ey + f =...
Platforms: Matlab
| License: Freeware | Size: 10 KB | Download (45): Ellipse Fit (Direct method) Download |
Added: August 13, 2013 | Visits: 582
This function plot in the same figure the center trajectory and attitude of an aircraft. See the figure to understand better.The version 2.0, extend the functionality of version 1. In this version there are much more body models [for example the tomcat (see the figure), the shuttle, the mig,...
Platforms: Matlab
| License: Freeware | Size: 1.74 MB | Download (43): Trajectory and Attitude Plot Version 2 Download |
Added: April 12, 2013 | Visits: 622
Syntax: plotdata; plotdata(hPlotFig); plotdata(figureName,sheetName,xdata,ydata, xAxisName,yHeaders,...); [hDataFig, hSpreadsheet] = plotdata(...); PLOTDATA(hPlotFig) scans the supplied figure handle for any plot axes; for each plot axes found, a new spreadsheet is created with the plot data...
Platforms: Matlab
| License: Freeware | Size: 40.96 KB | Download (46): PlotData - display plot raw-data in data-tables Download |
Added: July 25, 2013 | Visits: 469
Draws a circle or ellipse on a RGB image.can be used to insert circles into movies.Includes a little animation demo that demonstrates the use.
Platforms: Matlab
| License: Shareware | Cost: $0.00 USD | Size: 10 KB | Download (40): Circle/ellipse on RGB image Download |
Added: April 24, 2013 | Visits: 282
the given program is generation of ellipse and rotating it with respect to center......can anyone provide me a program for rotatin the ellipse with respect to its focus...??
Platforms: Matlab
| License: Shareware | Cost: $0.00 USD | Size: 10 KB | Download (43): ellipse rotation Download |
Added: September 12, 2013 | Visits: 453
function plot_ellipse(a,b,cx,cy,angle,color)%a: width in pixels%b: height in pixels%cx: horizontal center%cy: vertical center%angle: orientation ellipse in degrees%color: color code (e.g., 'r' or [0.4 0.5 0.1])
Platforms: Matlab
| License: Shareware | Cost: $0.00 USD | Size: 10 KB | Download (47): Simple ellipse plotting function Download |
Added: April 14, 2013 | Visits: 592
I wrote this to plot some overlapping data sets with there means and regions of +/- std deviations shown. It could be used for other purposes though.
Platforms: Matlab
| License: Freeware | Size: 10 KB | Download (47): Plot Overlapping Regions With Lines Download |
Added: November 22, 2006 | Visits: 4.585
 Rt-Plot is a tool to generate Cartesian X/Y-plots from scientific data. You can enter and calculate tabular data. View the changing graphs, including linear and non linear regression, interpolation, differentiation and integration, during entering. Rt-Plot enables you to create plots fast and...
Platforms: Windows
Rt-Plot is a tool to generate Cartesian X/Y-plots from scientific data. You can enter and calculate tabular data. View the changing graphs, including linear and non linear regression, interpolation, differentiation and integration, during entering. Rt-Plot enables you to create plots fast and...
Platforms: Windows
| License: Shareware | Cost: $50.00 USD | Size: 5.56 MB | Download (195): Rt-Plot Download |
Released: August 24, 2012
|
Added: August 24, 2012 | Visits: 561
 Coulson Plot Generator application creates a multiple pie diagram, for comparing subunit occupancy across a range of entities. Numbers of pies, segments, labels and colours are customisable. Creates an editable PDF from a comma separated text file.
Platforms: Windows, Mac, Solaris, Linux
Coulson Plot Generator application creates a multiple pie diagram, for comparing subunit occupancy across a range of entities. Numbers of pies, segments, labels and colours are customisable. Creates an editable PDF from a comma separated text file.
Platforms: Windows, Mac, Solaris, Linux
| License: Freeware | Size: 150.49 KB | Download (48): Coulson Plot Generator Download |
Added: September 10, 2013 | Visits: 480
Plot Digitizer is a Java program used to digitize scanned plots of functional data. Often data is found presented in reports and references as functional X-Y type scatter or line plots. In order to use this data, it must somehow be digitized. This program will allow you to take a scanned image of...
Platforms: Mac
| License: Freeware | Size: 1.16 MB | Download (47): Plot Digitizer Download |
Released: June 18, 2012
|
Added: June 18, 2012 | Visits: 349
Portable Plot is a pure ansi/iso c++ plot library that makes the construction of native plot widgets easy.
Platforms: Windows, Mac, Linux
| License: Freeware | Size: 456.67 KB | Download (45): portable plot Download |
Released: November 21, 2012
|
Added: November 21, 2012 | Visits: 435
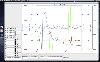 DAQ Plot is a simple to use strip chart application that permits real-time viewing and analysis of signals. Use simulated signals to understand data logging concepts without additional hardware and the inexpensive DLP-IO8-G data acquisition hardware (purc
Platforms: Mac
DAQ Plot is a simple to use strip chart application that permits real-time viewing and analysis of signals. Use simulated signals to understand data logging concepts without additional hardware and the inexpensive DLP-IO8-G data acquisition hardware (purc
Platforms: Mac
| License: Shareware | Cost: $14.99 USD | Size: 12.4 MB | Download (62): DAQ Plot Download |
Added: July 11, 2013 | Visits: 477
The available function to draw the Nyquist plot doesn't give the proper image of function. So here is the code to get the clear image.
Platforms: Matlab
| License: Freeware | Size: 10 KB | Download (43): Matlab, Nyquist, Power system, Plots, Nyquist plot. Download |