


Plot Directional Data software
Plot Directional Data
Released: September 21, 2013
|
Added: August 15, 2014 | Visits: 1.383
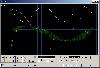
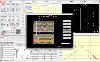
 Scientific data visualization software. Creating vertex, grid and surface model, Delaunay triangles, color map, contour plot, vector plot, 3D contour plot, 4D scatter, 4D slice and 4D vector.Creating graphs of regular data and irregular data. Creating vertex, grid and surface model, Delaunay...
Platforms: Windows, Windows 7, Windows Server
Scientific data visualization software. Creating vertex, grid and surface model, Delaunay triangles, color map, contour plot, vector plot, 3D contour plot, 4D scatter, 4D slice and 4D vector.Creating graphs of regular data and irregular data. Creating vertex, grid and surface model, Delaunay...
Platforms: Windows, Windows 7, Windows Server
| License: Demo | Cost: $150.00 USD | Size: 3.15 MB | Download (417): Visual Data For Academic Download |
Added: March 22, 2006 | Visits: 3.138
 Plot Observer is an AutoCAD add-on utility that silently records all print/plot activity in AutoCAD. Plot Observer records billing information, page size/sqaure footage, plotter name, and user information for each print/plot run in AutoCAD. Plot Observer records data in a central log file for...
Platforms: Windows
Plot Observer is an AutoCAD add-on utility that silently records all print/plot activity in AutoCAD. Plot Observer records billing information, page size/sqaure footage, plotter name, and user information for each print/plot run in AutoCAD. Plot Observer records data in a central log file for...
Platforms: Windows
| License: Shareware | Cost: $120.00 USD | Size: 3.32 MB | Download (169): Plot Observer Download |
Added: July 25, 2010 | Visits: 998
A free IDL (Interactive Data Language) compatible incremental compiler (ie. runs IDL programs). IDL is a registered trademark of Research Systems Inc. Full syntax compatibility with IDL 6.0 ALL IDL language elements are supported, including: - Objects, - Pointers, - Structs, - Arrays, -...
Platforms: *nix
| License: Freeware | Size: 839.68 KB | Download (97): The Data Language Download |
Added: January 25, 2010 | Visits: 1.078
[ Via Apple.com ] A fast, easy-to-use data analysis package that has been helping people understand their data since 1986. The program provides interactive tools for analysis and display based on the concepts and philosophy of Exploratory Data Analysis. Data Desk implements many traditional...
Platforms: Mac
| License: Demo | Cost: $0.00 USD | Download (101): Data Desk Download |
Released: September 10, 2012
|
Added: September 10, 2012 | Visits: 691
QtGrace is a small, easy to use application specially designed to offer users a program to display or plot data, analyze data and prepare it for printing.
This software is special because it combines the convenience of a graphical user interface with the power of a scripting language which...
Platforms: Windows, Windows Vista, 7
| License: Freeware | Download (454): QtGrace Download |
Released: July 07, 2012
|
Added: July 07, 2012 | Visits: 921
 Universal oscilloscope GUI ( Real-time plot ) DLL library for data acquisition, simulation, debugging.Advantages:1.Speedy performance: the library makes it possible to bring out into the beams of the viewing oscilloscope over a million quantization steps of signal per second (on the Pentium III...
Platforms: Windows, Windows Vista
Universal oscilloscope GUI ( Real-time plot ) DLL library for data acquisition, simulation, debugging.Advantages:1.Speedy performance: the library makes it possible to bring out into the beams of the viewing oscilloscope over a million quantization steps of signal per second (on the Pentium III...
Platforms: Windows, Windows Vista
| License: Freeware | Size: 3.54 MB | Download (127): Universal Software Oscilloscope Library Download |
Released: September 14, 2012
|
Added: September 14, 2012 | Visits: 631
 Data Master 2003 VCL component library provides you with high performance 2D graphics engine specially optimized for scientific and technical applications as well as other reusable components created for DM2003 software. You can visualize and edit numeric data as plot curves and worksheets,...
Platforms: Windows
Data Master 2003 VCL component library provides you with high performance 2D graphics engine specially optimized for scientific and technical applications as well as other reusable components created for DM2003 software. You can visualize and edit numeric data as plot curves and worksheets,...
Platforms: Windows
| License: Freeware | Size: 307.2 KB | Download (58): Data Master 2003 VCL Download |
Released: July 20, 2012
|
Added: July 20, 2012 | Visits: 890
 Comma-Separated Values (CSV) is a widespread, cross-platform file format for exchanging structured data sets. For example, Microsoft Office Outlook imports contacts stored in CSV format (called "DAT data files"). Microsoft Office Excel offers bi-directional (read and write) support for CSV files....
Platforms: Windows
Comma-Separated Values (CSV) is a widespread, cross-platform file format for exchanging structured data sets. For example, Microsoft Office Outlook imports contacts stored in CSV format (called "DAT data files"). Microsoft Office Excel offers bi-directional (read and write) support for CSV files....
Platforms: Windows
| License: Freeware | Size: 5.03 MB | Download (57): SharePoint List Data Export to CSV/Excel Download |
Added: September 10, 2013 | Visits: 480
Plot Digitizer is a Java program used to digitize scanned plots of functional data. Often data is found presented in reports and references as functional X-Y type scatter or line plots. In order to use this data, it must somehow be digitized. This program will allow you to take a scanned image of...
Platforms: Mac
| License: Freeware | Size: 1.16 MB | Download (47): Plot Digitizer Download |
Released: August 04, 2012
|
Added: August 04, 2012 | Visits: 417
 The Directional Drilling Survey provides the control of the directional drilling of oil wells with calculations and plotting of well planning and survey data to help technicians, drillers, toolpushers and engineers of petroleum industry.
Featu
Platforms: Mac
The Directional Drilling Survey provides the control of the directional drilling of oil wells with calculations and plotting of well planning and survey data to help technicians, drillers, toolpushers and engineers of petroleum industry.
Featu
Platforms: Mac
| License: Shareware | Cost: $19.99 USD | Size: 1.2 MB | Download (51): Directional Drilling Download |
Added: May 10, 2013 | Visits: 366
It can be used to plot only discrete data, not having support for mathematical functions. Limitations: - Does not support functions. - Don't suit all applciations.
Platforms: Windows, Mac, *nix, Python, BSD Solaris
| License: Freeware | Download (54): Graphication Download |
Added: August 27, 2013 | Visits: 631
pbest=EASYFIT(x,y,varargin) fits the data Y = f(X) to a model function Y = FUN(P,X).If FUN is not given as an input argument, POLYFIT is used as the model function.Bounds on the parameters P may be set.By default a plot is generated which presents the data as well the "best" curve, confidence...
Platforms: Matlab
| License: Freeware | Size: 10 KB | Download (49): Fit experimental data is easy Download |
Added: June 23, 2013 | Visits: 665
The main features are: Plot. For each immitance types (Z, Y, C or M), the data can be plotted in the complex plane, as well their real, imaginary parts or their magnitude in function of the frequency (Log/Log). Simulation. The possibilities are almost infinite. Over the classical R, C, L...
Platforms: Matlab
| License: Freeware | Size: 10 KB | Download (52): ZfitGUI(varargin) fits and simulates impedance data Download |
Added: September 10, 2013 | Visits: 433
Take a set of speed or distance data with a direction and create a radar-like plot...
Platforms: Matlab
| License: Shareware | Cost: $0.00 USD | Size: 10 KB | Download (43): Radar-like Plot Download |
Added: September 09, 2013 | Visits: 492
If you have a data file and want to plot a cumulative distribution function (CDF) with almost no work, this is the way to go. Also presented is a way to grab some values from the CDF curve, and a way to generate a PDF using standard Matlab functions.
Platforms: Matlab
| License: Shareware | Cost: $0.00 USD | Size: 10 KB | Download (45): Simple Method to Generate a CDF plot Download |
Added: March 25, 2013 | Visits: 397
By Ola Fredin & Lena Rubensdotter; Geological Survey of NorwayUnderstanding densely sampled data from a sediment core or section can be difficult, and there are many statistical tools to tell how, for example grain size distribution varies over time/depth in a sediment sample. However, it is...
Platforms: Matlab
| License: Shareware | Cost: $0.00 USD | Size: 40.96 KB | Download (51): 3D plot of grain size data in sedimentology Download |
Added: April 27, 2013 | Visits: 468
Plot data in a figure, and then interactively choose regression area. The result from polyfit is returned.Example:x=1:1:10;y=sin(x);f=figure; plot( x,y );[p,h] = figreg( f, 2 );%fit a second order polynom to selected region in plot
Platforms: Matlab
| License: Shareware | Cost: $0.00 USD | Size: 10 KB | Download (43): Interactive regression on a plot Download |
Added: June 17, 2013 | Visits: 318
Give a dot plot for one data group. It could rerun the function by changing the 'data' and 'groupNum' for multi-group. It should run the function one times for each group, and they will show in the same diagram. The dot plot could also combine with box plot. Syntax dotPlot_xtr( data )...
Platforms: Matlab
| License: Shareware | Cost: $0.00 USD | Size: 10 KB | Download (43): Dot plot rather than scatter plot Download |
Added: August 06, 2013 | Visits: 489
Simple PLOT , ZOOM and FFT for various oscilloscpope, Simulink or Matlab data formats No input parameter is required to start the program. Input data are selected and loaded from the top-level (start) GUI --->> GetData_vxx.fig.Implements the selection of a workspace variable generated in the...
Platforms: Matlab
| License: Shareware | Cost: $0.00 USD | Size: 112.64 KB | Download (47): Simple Plot, Zoom and FFT GUI Download |
Added: June 28, 2013 | Visits: 279
This version of "plot" will allow you to visualize data that has very large number of elements. Plotting large data set makes your graphics sluggish, but most times you don't need all of the information displayed in the plot. Your screen only has so many pixels, and your eyes won't be able to...
Platforms: Matlab
| License: Shareware | Cost: $0.00 USD | Size: 10 KB | Download (47): DSPLOT - downsampled plot Download |