


Plot Digitizer software
Plot Digitizer
Added: September 10, 2013 | Visits: 474
 Plot Digitizer is a Java program used to digitize scanned plots of functional data. Often data is found presented in reports and references as functional X-Y type scatter or line plots. In order to use this data, it must somehow be digitized. This program will allow you to take a scanned image of...
Platforms: Mac
| License: Freeware | Size: 1.16 MB | Download (47): Plot Digitizer Download |
Released: June 06, 2004
|
Added: January 24, 2006 | Visits: 3.189
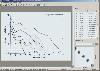
 The "xyExtract" software is used for to extract data from a 2D graph (orthogonal and nonorthogonal axes) contained in a graphic file (scanned, PDF document or in a some file like gif, jpg, etc). The graphic file must be saved in a bitmap file. Then, the "xyExtract" converts the graph back to xy...
| License: Shareware | Cost: $25.00 USD | Size: 450 KB | Download (771): xyExtract Graph Digitizer Download |
Added: September 16, 2013 | Visits: 238
This utility digitizes the xy scator plot from picture.
Platforms: Matlab
| License: Shareware | Cost: $0.00 USD | Size: 10 KB | Download (44): Scalar plot digitizer Download |
Released: June 06, 2004
|
Added: July 17, 2006 | Visits: 5.463
 The LAB Fit is a software for Windows developed for treatment and analysis of experimental data. At LABFit program you are able to: 1) Treat similar data; 2) Treat non-similar data; 3) Determine propagated error; 4) Plot 2D and 3D graph; 5) Execute math calculations (system of equations, roots of...
Platforms: Windows, Windows CE
| License: Shareware | Cost: $60.00 USD | Size: 2.96 MB | Download (787): LAB Fit Curve Fitting Software Download |
Added: March 17, 2006 | Visits: 7.147
 Program for digitizing XY graphs and maps. Both automatic and manual digitizing. Supported graphics formats are TIFF, JPEG, BMP, and PCX. Allows to save current workspace and return to unfinished work later. Obtained digital data may be copied to the clipboard (and then pasted into e.g. MS Excel)...
Platforms: Windows
| License: Shareware | Cost: $30.00 USD | Size: 1.05 MB | Download (521): GetData Download |
Added: March 22, 2006 | Visits: 3.133
Plot Observer is an AutoCAD add-on utility that silently records all print/plot activity in AutoCAD. Plot Observer records billing information, page size/sqaure footage, plotter name, and user information for each print/plot run in AutoCAD. Plot Observer records data in a central log file for...
Platforms: Windows
| License: Shareware | Cost: $120.00 USD | Size: 3.32 MB | Download (169): Plot Observer Download |
Added: January 09, 2010 | Visits: 2.550
Chart::Plot::Canvas is a Perl module to plot two dimensional data in an Tk Canvas. SYNOPSIS use Chart::Plot::Canvas; my $img = Chart::Plot::Canvas->new(); my $anotherImg = Chart::Plot::Canvas->new ($image_width, $image_height); $img->setData (@dataset) or die( $img->error() );...
Platforms: *nix
| License: Freeware | Size: 5.12 KB | Download (162): Chart::Plot::Canvas Download |
Added: July 22, 2010 | Visits: 1.304
Engauge Digitizer project is digitizing software that converts an image showing a graph or map into numbers. The image file can come from a scanner, digital camera, or screenshot. The numbers can be read on the screen, and written or copied to a spreadsheet. Highlights for beginners include an...
Platforms: *nix
| License: Freeware | Size: 9.1 MB | Download (179): Engauge Digitizer Download |
Added: January 22, 2010 | Visits: 1.651
Chart::Plot is a Perl module to plot two dimensional data in an image. SYNOPSIS use Chart::Plot; my $img = Chart::Plot->new(); my $anotherImg = Chart::Plot->new ($image_width, $image_height); $img->setData (@dataset) or die( $img->error() ); $img->setData (@xdataset, @ydataset);...
Platforms: *nix
| License: Freeware | Size: 15.36 KB | Download (116): Chart::Plot Download |
Released: August 23, 2012
|
Added: August 23, 2012 | Visits: 704
Function Plot 2D is a small, simple, Java based application specially designed to help you create function plots.
Function Plot 2D lets you create a 2D plot, all you need to do is give an input function.
for WindowsAll
Platforms: Windows
| License: Freeware | Download (443): Function Plot 2D Download |
Released: August 23, 2012
|
Added: August 23, 2012 | Visits: 750
Function Plot 2D with Sections is a small, simple, Java based application specially designed to help you create function plots.
Function Plot 2D lets you create a 2D plot, all you need to do is give an input function.
for WindowsAll
Platforms: Windows
| License: Freeware | Download (449): Function Plot 2D with Sections Download |
Added: May 10, 2013 | Visits: 751
This open source, digitizing software converts an image file showing a graph or map, into numbers. The image file can come from a scanner, digital camera or screenshot. The numbers can be read on the screen, and written or copied to a spreadsheet. The process starts with an image file containing...
Platforms: Windows, Mac, *nix, C/C++, BSD
| License: Freeware | Download (60): Engauge Digitizer Download |
Added: August 13, 2013 | Visits: 577
This function plot in the same figure the center trajectory and attitude of an aircraft. See the figure to understand better.The version 2.0, extend the functionality of version 1. In this version there are much more body models [for example the tomcat (see the figure), the shuttle, the mig,...
Platforms: Matlab
| License: Freeware | Size: 1.74 MB | Download (43): Trajectory and Attitude Plot Version 2 Download |
Added: April 12, 2013 | Visits: 617
Syntax: plotdata; plotdata(hPlotFig); plotdata(figureName,sheetName,xdata,ydata, xAxisName,yHeaders,...); [hDataFig, hSpreadsheet] = plotdata(...); PLOTDATA(hPlotFig) scans the supplied figure handle for any plot axes; for each plot axes found, a new spreadsheet is created with the plot data...
Platforms: Matlab
| License: Freeware | Size: 40.96 KB | Download (46): PlotData - display plot raw-data in data-tables Download |
Added: April 14, 2013 | Visits: 588
I wrote this to plot some overlapping data sets with there means and regions of +/- std deviations shown. It could be used for other purposes though.
Platforms: Matlab
| License: Freeware | Size: 10 KB | Download (47): Plot Overlapping Regions With Lines Download |
Added: November 22, 2006 | Visits: 4.581
 Rt-Plot is a tool to generate Cartesian X/Y-plots from scientific data. You can enter and calculate tabular data. View the changing graphs, including linear and non linear regression, interpolation, differentiation and integration, during entering. Rt-Plot enables you to create plots fast and...
Platforms: Windows
| License: Shareware | Cost: $50.00 USD | Size: 5.56 MB | Download (195): Rt-Plot Download |
Added: August 20, 2008 | Visits: 1.125
 Graph Digitizer Scout automatically converts hard-copy graphs, oscillograms, charts, plots, into X,Y. Different recognition methods including manual correction mode. Data can be exported to Excel, CSV format and other applications.
Platforms: Windows
| License: Demo | Cost: $35.00 USD | Size: 5.21 MB | Download (126): Graph Digitizer Scout Download |
Added: August 31, 2008 | Visits: 1.039
 Precision Image Digitizer - Trace & record the coordinates of your selected points in a JPG, GIF, or BMP. Point and click on the points in the image that you would like to record. The coordinates are displayed on the screen as you click them and they can then be exported to an ASCII text file,...
Platforms: Windows
| License: Shareware | Cost: $5.00 USD | Size: 4.27 MB | Download (571): Precision Image Digitizer Download |
Released: November 16, 2012
|
Added: November 16, 2012 | Visits: 452
 dcsDigitiser, a graph digitizer and densitometer, converts graphs into digital X-Y numerical numbers for peer analysis of graphs and gel in the open literature and/or of your own hard copies. With excellent performance, dcsDigitiser is accurate, precise, versatile and straightforward in its use....
Platforms: Windows
| License: Shareware | Cost: $120.00 USD | Size: 3.81 MB | Download (53): dcsDigitiser Graph Digitizer Densitomete Download |
Released: August 24, 2012
|
Added: August 24, 2012 | Visits: 555
 Coulson Plot Generator application creates a multiple pie diagram, for comparing subunit occupancy across a range of entities. Numbers of pies, segments, labels and colours are customisable. Creates an editable PDF from a comma separated text file.
Platforms: Windows, Mac, Solaris, Linux
| License: Freeware | Size: 150.49 KB | Download (48): Coulson Plot Generator Download |