


Plot Diagram software
Plot Diagram
Released: August 18, 2012
|
Added: August 18, 2012 | Visits: 434
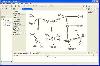
 State Diagram Editor is a compact, flexible tool for the design of Finite State Machines
- Intuitive User Interface using Drag&Drop
- Simple Testing supported by visualized Execution
- Support for the Design of complex Models using FS
State Diagram Editor is a compact, flexible tool for the design of Finite State Machines
- Intuitive User Interface using Drag&Drop
- Simple Testing supported by visualized Execution
- Support for the Design of complex Models using FS
Platforms: Mac
| License: Shareware | Cost: $37.99 USD | Size: 2.8 MB | Download (51): State Diagram Editor Download |
Added: September 04, 2013 | Visits: 401
 PLOTWINDIRVEL can be used to plot wind direction versus wind velocity (read strength) on a compass plot.I have included two scripts to show you how to use the function. If you run the first script make sure the datafile is co-resident with the two MATLAB-files. Here is a snippet from the second...
Platforms: Matlab
| License: Shareware | Cost: $0.00 USD | Size: 10 KB | Download (51): Plot Wind Direction versus Wind Speed Download |
Added: May 06, 2013 | Visits: 822
This m-file plots a NMR coupling diagram from coupling constants and number of splits (only 1/2-spin nuclei). Useful for educational purposes.Example: plotcoupling([8,2],[3,1])Produces a plot with the coupling constants 8 and 2 Hz, splitted three and one times, respectively.The screenshot is made...
Platforms: Matlab
| License: Freeware | Size: 10 KB | Download (50): NMR coupling diagram Download |
Added: July 14, 2013 | Visits: 394
Coulson Plot Generator application creates a multiple pie diagram, for comparing subunit occupancy across a range of entities. Numbers of pies, segments, labels and colours are customisable. Creates an editable PDF from a comma separated text file.
Platforms: Mac
| License: Shareware | Cost: $0.00 USD | Size: 419.84 KB | Download (50): Coulson Plot Generator Download |
Released: July 25, 2012
|
Added: July 25, 2012 | Visits: 622
 An Eclipse plugin for generating code out of an Entity-Relationship-Diagram (ERD). Currently SQL-DDL and POJO classes with EJB3.0 Annotations are supported. The diagrams conform to the diagram description by H. Buff (german book, ISBN 3-03-440201-5)
Platforms: Windows, Mac, Linux
| License: Freeware | Size: 299.24 KB | Download (50): ER diagram editor for eclipse Download |
Added: August 06, 2013 | Visits: 520
This function generates mesh plot with 3Dbars at specific (x,y) points by using fill3 function.This function uses MATLAB's fill3.m meant to generate Filled 3-D polygons.
Platforms: Matlab
| License: Shareware | Cost: $0.00 USD | Size: 20.48 KB | Download (50): Generating surface plot with bars at specific (x,y) points Download |
Released: August 18, 2012
|
Added: August 18, 2012 | Visits: 516
 Reflective Ecore Model Diagram Editor is a GMF based Eclipse plugin which provides a graphical editor for any EMF model file, using only the meta-model such as .ecore and .xsd file. You don't need any .gmfgraph, .gmftool, .gmfmap, or .gmfgen files.
Platforms: Windows, Mac, Linux
| License: Freeware | Size: 231.75 KB | Download (49): Reflective Ecore Model Diagram Editor Download |
Released: August 24, 2012
|
Added: August 24, 2012 | Visits: 558
 Coulson Plot Generator application creates a multiple pie diagram, for comparing subunit occupancy across a range of entities. Numbers of pies, segments, labels and colours are customisable. Creates an editable PDF from a comma separated text file.
Platforms: Windows, Mac, Solaris, Linux
| License: Freeware | Size: 150.49 KB | Download (48): Coulson Plot Generator Download |
Added: June 07, 2013 | Visits: 592
To plot the stability chart or Ince strut diagram of Mathieu Equation Mathieu Equation is a special type of Hill's equation, which is a non- autonomous differential equation. The focal point in this is stability if the solution, which is shown as plot of system parameters. Method's like...
Platforms: Matlab
| License: Shareware | Cost: $0.00 USD | Size: 266.24 KB | Download (48): Stability Chart Download |
Added: July 18, 2013 | Visits: 837
The programs compute the enthalpy versus composition diagram for ethanol-water binary system at 760mmHg and 76 mmHg. We also draw the tie lines and the conjugate line.
Platforms: Matlab
| License: Freeware | Size: 30.72 KB | Download (47): Enthalpy versus Composition Diagram for Ethanol-Water at 760 mmHg and 76 mmHg Download |
Added: April 14, 2013 | Visits: 590
I wrote this to plot some overlapping data sets with there means and regions of +/- std deviations shown. It could be used for other purposes though.
Platforms: Matlab
| License: Freeware | Size: 10 KB | Download (47): Plot Overlapping Regions With Lines Download |
Added: September 10, 2013 | Visits: 477
Plot Digitizer is a Java program used to digitize scanned plots of functional data. Often data is found presented in reports and references as functional X-Y type scatter or line plots. In order to use this data, it must somehow be digitized. This program will allow you to take a scanned image of...
Platforms: Mac
| License: Freeware | Size: 1.16 MB | Download (47): Plot Digitizer Download |
Added: August 06, 2013 | Visits: 485
Simple PLOT , ZOOM and FFT for various oscilloscpope, Simulink or Matlab data formats No input parameter is required to start the program. Input data are selected and loaded from the top-level (start) GUI --->> GetData_vxx.fig.Implements the selection of a workspace variable generated in the...
Platforms: Matlab
| License: Shareware | Cost: $0.00 USD | Size: 112.64 KB | Download (47): Simple Plot, Zoom and FFT GUI Download |
Added: June 28, 2013 | Visits: 277
This version of "plot" will allow you to visualize data that has very large number of elements. Plotting large data set makes your graphics sluggish, but most times you don't need all of the information displayed in the plot. Your screen only has so many pixels, and your eyes won't be able to...
Platforms: Matlab
| License: Shareware | Cost: $0.00 USD | Size: 10 KB | Download (47): DSPLOT - downsampled plot Download |
Added: May 23, 2013 | Visits: 268
2D Plot function; can be complied using MATLAB compiler.
Platforms: Matlab
| License: Shareware | Cost: $0.00 USD | Size: 81.92 KB | Download (47): simple x-y plot from *.txt Download |
Added: April 12, 2013 | Visits: 617
Syntax: plotdata; plotdata(hPlotFig); plotdata(figureName,sheetName,xdata,ydata, xAxisName,yHeaders,...); [hDataFig, hSpreadsheet] = plotdata(...); PLOTDATA(hPlotFig) scans the supplied figure handle for any plot axes; for each plot axes found, a new spreadsheet is created with the plot data...
Platforms: Matlab
| License: Freeware | Size: 40.96 KB | Download (46): PlotData - display plot raw-data in data-tables Download |
Added: May 16, 2013 | Visits: 449
This function plot in the same figure the center trajectory and attitude of an aircraft. See the figure to understand better.The version 3.0, extend the functionality of version 2.In this last version :- fixed the Reference System Bugs- possibility to export the trajectory animation in avi format...
Platforms: Matlab
| License: Freeware | Size: 10 KB | Download (46): Trajectory and Attitude Plot Version 3 Download |
Added: September 11, 2013 | Visits: 313
I just need to simply plot the 5 and 95 percentile as well as mean.The cross mark implies median.
Platforms: Matlab
| License: Shareware | Cost: $0.00 USD | Size: 10 KB | Download (46): High-Low plot or percentile (5 and 95) plot Download |
Added: April 15, 2013 | Visits: 339
This code is used to generate 1D bifurcation plot for any 1D map with one parameter. Compared to those existent bifurcation plot tools in Matlab central, this plot tool runs much faster and uses much less memory. Please remember to rate, if you like my code. Thanks
Platforms: Matlab
| License: Shareware | Cost: $0.00 USD | Size: 10 KB | Download (46): 1D Bifurcation plot Download |
Added: May 03, 2013 | Visits: 477
This prog calculates and plots the wave-vector diagram (i.e. photonic bands at constant frequency) for a 2D photonic crystal consisting of cylinders with circular cross-section andinfinite height, arranged in a triangular lattice; oblique propagation is implicit, so the polarization states cannot...
Platforms: Matlab
| License: Shareware | Cost: $0.00 USD | Size: 10 KB | Download (46): Wave-vector diagram for a 2D photonic crystal Download |