


Graphs Plotting software
Graphs Plotting
Added: January 01, 2006 | Visits: 7.936
 3D Grapher is a feature-rich yet easy-to-use graph plotting and data visualization software suitable for students, engineers and everybody who needs to work with 2D and 3D graphs. With 3D Grapher you can easily plot the equation and table-based graphs, zoom them, rotate, view at any angle and...
Platforms: Windows
3D Grapher is a feature-rich yet easy-to-use graph plotting and data visualization software suitable for students, engineers and everybody who needs to work with 2D and 3D graphs. With 3D Grapher you can easily plot the equation and table-based graphs, zoom them, rotate, view at any angle and...
Platforms: Windows
| License: Shareware | Cost: $24.95 USD | Size: 728 KB | Download (942): 3D Grapher Download |
Released: September 22, 2009
|
Added: October 09, 2009 | Visits: 1.439
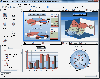 DataScene is a data graphing, animation, and analysis software package. It allows the user to easily plot 2D & 3D graphs (Area, Bar, Pie, Line, Surface, Ploar, and more) with scientific, financial, and statistical data, to manipulate, print, and export high quality graphs, to analyze data with...
Platforms: Windows
DataScene is a data graphing, animation, and analysis software package. It allows the user to easily plot 2D & 3D graphs (Area, Bar, Pie, Line, Surface, Ploar, and more) with scientific, financial, and statistical data, to manipulate, print, and export high quality graphs, to analyze data with...
Platforms: Windows
| License: Shareware | Cost: $219.00 USD | Size: 44.07 MB | Download (885): DataScene Download |
Added: August 22, 2006 | Visits: 2.921
 GraphSight Junior is an easy to use freeware handy 2D math-graphing program. It was originally designed to help students and teachers satisfy their day-after-day math plotting needs. It makes it easy to plot and explore common Y(X) = F(X) Cartesian graphs, set text labels on the coordinate plane,...
Platforms: Windows
GraphSight Junior is an easy to use freeware handy 2D math-graphing program. It was originally designed to help students and teachers satisfy their day-after-day math plotting needs. It makes it easy to plot and explore common Y(X) = F(X) Cartesian graphs, set text labels on the coordinate plane,...
Platforms: Windows
| License: Freeware | Size: 393 KB | Download (726): GraphSight Junior Download |
Released: January 07, 2003
|
Added: November 22, 2006 | Visits: 3.268
 Web Enabled solution for creating Stacked Horizontal Charts & Graphs. Versatile components for web authors and developers to easily build and publish dynamic and interactive bar graphs.
Database Access Methods (Direct Data Binding and Multi-Tier)
Template Scripts and Implementations (ASP,...
Platforms: DOS, Windows, Mac, *nix, Windows CE
Web Enabled solution for creating Stacked Horizontal Charts & Graphs. Versatile components for web authors and developers to easily build and publish dynamic and interactive bar graphs.
Database Access Methods (Direct Data Binding and Multi-Tier)
Template Scripts and Implementations (ASP,...
Platforms: DOS, Windows, Mac, *nix, Windows CE
| License: Shareware | Cost: $49.95 USD | Size: 259 KB | Download (722): 3D Stacked Horizontal Bar Graph Software Download |
Released: April 01, 2006
|
Added: January 25, 2007 | Visits: 3.945
 Display your data with built-in graphs or WYSIWYG html editor
Platforms: Windows, *nix
Display your data with built-in graphs or WYSIWYG html editor
Platforms: Windows, *nix
| License: Shareware | Cost: $0.00 USD | Size: 6.3 MB | Download (708): WebGrid DataGrid/Graphs/WYSIWYG html editor Download |
Released: March 09, 2009
|
Added: August 15, 2014 | Visits: 6.353
 Powerful but easy-to-use graphing, curve fitting and calculating software. Graphs Cartesian (Y(x) and X(y)), polar and parametric functions, graphs of tables, equations (implicit functions), inequalities and slope fields. Up to 100 graphs in one window. Calculus features: regression analysis,...
Platforms: Windows
Powerful but easy-to-use graphing, curve fitting and calculating software. Graphs Cartesian (Y(x) and X(y)), polar and parametric functions, graphs of tables, equations (implicit functions), inequalities and slope fields. Up to 100 graphs in one window. Calculus features: regression analysis,...
Platforms: Windows
| License: Shareware | Cost: $29.95 USD | Size: 1.38 MB | Download (704): Advanced Grapher Download |
Released: October 01, 2002
|
Added: June 20, 2006 | Visits: 5.811
 DigitizeIt digitizes scanned graphs. Graphs can be loaded in nearly all common image formats (incl. gif,tiff,jpeg,bmp,png) or pasted from the clipboard . Digitizing of line and scatter plots occurs automatically, manual digitizing is also possible. Data values are transformed to a specified axes...
Platforms: Windows, Mac, *nix
DigitizeIt digitizes scanned graphs. Graphs can be loaded in nearly all common image formats (incl. gif,tiff,jpeg,bmp,png) or pasted from the clipboard . Digitizing of line and scatter plots occurs automatically, manual digitizing is also possible. Data values are transformed to a specified axes...
Platforms: Windows, Mac, *nix
| License: Shareware | Cost: $39.00 USD | Size: 8.61 MB | Download (684): DigitizeIt Download |
Released: January 10, 2002
|
Added: May 10, 2006 | Visits: 8.719
 3DMath Explorer is a computer program that pilots 2D and 3D graphs of mathematical functions and curves in unlimited graphing space. It has many useful feature such as 3D curve ploting in real time, perspective drawing, graph scaling (zooming), active graph rotation, fogging effect, cubic draw,...
Platforms: Windows
3DMath Explorer is a computer program that pilots 2D and 3D graphs of mathematical functions and curves in unlimited graphing space. It has many useful feature such as 3D curve ploting in real time, perspective drawing, graph scaling (zooming), active graph rotation, fogging effect, cubic draw,...
Platforms: Windows
| License: Shareware | Cost: $45.00 USD | Size: 2.33 MB | Download (610): 3DMath Explorer Download |
Added: August 05, 2008 | Visits: 2.118
 Trigonometric Graphs renders a number of moving fragments of sine and cosine graphs, meant to be visually attractive. The application is designed for use on a modern LCD.
Platforms: Windows
Trigonometric Graphs renders a number of moving fragments of sine and cosine graphs, meant to be visually attractive. The application is designed for use on a modern LCD.
Platforms: Windows
| License: Freeware | Size: 517 KB | Download (606): Trigonometric Graphs Download |
Added: November 01, 2006 | Visits: 14.964
 ImageDIG consists of three integrated modules which allow the user to convert 2D flat images into 3D (x,y,z) data or if a graph, convert the graph in image form into 2 dimensional numerical data. The third module is a full analysis plotting utility where the user can import either the 2D or 3D...
Platforms: Windows
ImageDIG consists of three integrated modules which allow the user to convert 2D flat images into 3D (x,y,z) data or if a graph, convert the graph in image form into 2 dimensional numerical data. The third module is a full analysis plotting utility where the user can import either the 2D or 3D...
Platforms: Windows
| License: Shareware | Cost: $89.95 USD | Size: 5.67 MB | Download (580): ImageDIG 2D/3D image digitizer Download |
Added: July 14, 2010 | Visits: 1.977
Artichow is a complete framework to create statistical graphs such as line, bar, or radar plots, pies charts, and so on. Artichow can also produce antispam images for applications such as user account creation. Whats New in This Release: - This version comes with a mostly rewritten new...
Platforms: *nix
| License: Freeware | Size: 184.32 KB | Download (522): Artichow Download |
Released: June 26, 2012
|
Added: June 26, 2012 | Visits: 1.003
 With 1-2-3 PieCharts you can now quickly and easily create professional looking 3d graphs without any of the usual hassle. This 3d graph software from Java is the perfect way to show statistics and information in an eye-catching and easy to understand way.If you download this 3d graph software...
Platforms: Windows
With 1-2-3 PieCharts you can now quickly and easily create professional looking 3d graphs without any of the usual hassle. This 3d graph software from Java is the perfect way to show statistics and information in an eye-catching and easy to understand way.If you download this 3d graph software...
Platforms: Windows
| License: Freeware | Size: 2.93 MB | Download (506): Make Professional looking graphs with Java 3d Graph Software Download |
Released: November 26, 2012
|
Added: November 26, 2012 | Visits: 384
The Plot.py project tries to supply an easy to use measurement data visualization and treatment framework being easy to use while keeping the freedom for advanced users to execute additional data treatment algorithms. The program is build on a object oriented modular basis to provide the...
Platforms: Windows
| License: Freeware | Size: 41.9 MB | Download (503): Plotting GUI Download |
Released: November 19, 2012
|
Added: November 19, 2012 | Visits: 348
 The Plot.py project tries to supply an easy to use measurement data visualization and treatment framework being easy to use while keeping the freedom for advanced users to execute additional data treatment algorithms. The program is build on a object oriented modular basis to provide the...
Platforms: Linux
The Plot.py project tries to supply an easy to use measurement data visualization and treatment framework being easy to use while keeping the freedom for advanced users to execute additional data treatment algorithms. The program is build on a object oriented modular basis to provide the...
Platforms: Linux
| License: Freeware | Size: 850 KB | Download (485): Plotting GUI for Linux 0.7.13 Beta Download |
Released: November 04, 2012
|
Added: November 04, 2012 | Visits: 557
MOPlot is a handy visualization application specially designed for fast molecular orbitals plotting from the outputs of the Gaussian 03/98/94, Molcas, Gamess/US quantum chemical calculation packages. This Molecular Orbital Plotting Program will prove to be easy-to-use and very efficient.
MOPlot...
Platforms: Windows, XP
| License: Freeware | Download (478): MOPlot Download |
Released: September 12, 2012
|
Added: September 12, 2012 | Visits: 707
DataScene Professional is a scientific application that helps you design graphs and graph animation. It is also capable to perform data analysis, curve fitting, and data monitoring.
It allows the user to easily plot 2D & 3D graphs (Area, Bar, Pie, Line, Surface, Ploar, and more), to manipulate,...
Platforms: Windows
| License: Freeware | Download (459): DataScene Professional Download |
Released: October 25, 2012
|
Added: October 25, 2012 | Visits: 500
 RLPlot is is a plotting program to create high quality graphs from data. Based on values stored in a spreadsheet several menus help you to create graphs of your choice. The Graphs are displayed as you get them (wysiwyg). Double click any element of the graph (or a single click with the right...
Platforms: Windows
RLPlot is is a plotting program to create high quality graphs from data. Based on values stored in a spreadsheet several menus help you to create graphs of your choice. The Graphs are displayed as you get them (wysiwyg). Double click any element of the graph (or a single click with the right...
Platforms: Windows
| License: Freeware | Size: 1.2 MB | Download (455): RLPlot for Mac OS X Download |
Released: October 08, 2012
|
Added: October 08, 2012 | Visits: 525
 GreatCirc is a tool for calculating Great Circle distances on the earth's surface, and plotting points and great circle paths on a world map.
The "great circle path" is the shortest direct route between two points on the earth's surface. Because the earth is a globe, the shortest path between...
Platforms: Windows
GreatCirc is a tool for calculating Great Circle distances on the earth's surface, and plotting points and great circle paths on a world map.
The "great circle path" is the shortest direct route between two points on the earth's surface. Because the earth is a globe, the shortest path between...
Platforms: Windows
| License: Freeware | Size: 2.2 MB | Download (455): GreatCirc Download |
Released: September 10, 2012
|
Added: September 10, 2012 | Visits: 426
 Veusz is a GUI scientific plotting and graphing package. It is designed to produce publication-ready Postscript or PDF output. SVG, EMF and bitmap export formats are also supported. The program runs under Unix/Linux, Windows or Mac OS X, and binaries are provided. Data can be read from text, CSV...
Platforms: Linux
Veusz is a GUI scientific plotting and graphing package. It is designed to produce publication-ready Postscript or PDF output. SVG, EMF and bitmap export formats are also supported. The program runs under Unix/Linux, Windows or Mac OS X, and binaries are provided. Data can be read from text, CSV...
Platforms: Linux
| License: Freeware | Size: 10.2 MB | Download (451): Veusz for Linux Download |
Released: September 08, 2012
|
Added: September 08, 2012 | Visits: 625
 DataScene is a scientific graphing, graph animation, data analysis, curve fitting, and data monitoring program. It allows the user to easily plot 2D & 3D graphs (Area, Bar, Pie, Line, Surface, Ploar, and more), to manipulate, print, and export high quality graphs, to analyze data with various...
Platforms: Windows
DataScene is a scientific graphing, graph animation, data analysis, curve fitting, and data monitoring program. It allows the user to easily plot 2D & 3D graphs (Area, Bar, Pie, Line, Surface, Ploar, and more), to manipulate, print, and export high quality graphs, to analyze data with various...
Platforms: Windows
| License: Shareware | Cost: $349.00 USD | Size: 44.07 MB | Download (449): DataScene Professional for Windows Download |