


Graph Trigonometric Function software
Graph Trigonometric Function
Added: September 12, 2010 | Visits: 1.483
 Graph::Flowchart is a Perl module that can generate easily flowcharts as Graph::Easy objects. SYNOPSIS use Graph::Flowchart; my $flow = Graph::Flowchart->new(); print $flow->as_ascii(); This module lets you easily create flowcharts as Graph::Easy objects. This means you can output your...
Platforms: *nix
| License: Freeware | Size: 34.82 KB | Download (171): Graph::Flowchart Download |
Added: January 18, 2010 | Visits: 1.660
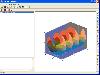
Chart::Graph::Xrt3d is a Perl module for creating 3D graph charts. SYNOPSIS #Include module use Chart::Graph::Xrt3d qw(xrt3d); # Function call xrt3d(%options, @data_set ); This module is unmaintained, it worked with Sitrakas XRT, and hasnt been tested against newer versions. Sitraka...
Platforms: *nix
| License: Freeware | Size: 245.76 KB | Download (169): Chart::Graph::Xrt3d Download |
Added: January 18, 2010 | Visits: 2.265
Chart::Graph::Gnuplot is a function in module Chart::Graph that lets you generate graphs on the fly in perl. SYNOPSIS use Chart::Graph::Gnuplot qw(&gnuplot); gnuplot(%global_options, [%data_set_options, @matrix], [%data_set_options, @x_column, @y_column], [%data_set_options, < filename...
Platforms: *nix
| License: Freeware | Size: 8.19 KB | Download (167): Chart::Graph::Gnuplot Download |
Released: January 12, 2005
|
Added: June 26, 2006 | Visits: 2.407
 Archim is a program for drawing the graphs of all kinds of functions. You can define a graph explicitly and parametrically, in polar and spherical coordinates, on a plane and in space (surface). Archim will be useful for teachers and students, as well as for everyone who is interested min...
Platforms: Windows
| License: Shareware | Cost: $25.00 USD | Size: 648 KB | Download (161): Archim Download |
Added: August 18, 2008 | Visits: 2.471
Insta-Graph is an add-in for Microsoft Excel that will revolutionize the way you create and use graphs (aka charts) in Excel. Anyone who has to analyze information, identify trends, prepare budgets, forecasts, or look at any other information in Excel where graphing is helpful will benefit from...
Platforms: Windows
| License: Shareware | Cost: $47.97 USD | Size: 9.31 MB | Download (160): Insta-Graph Download |
Added: August 22, 2008 | Visits: 1.422
Graph Plotter is a powerful tool which can help you to plot and analyze different types of graphs. It is easy-to-use and user-friendly. In addition it can find asymptotes of function, break points, extremums and calculate limit, define integral, derivative of function and more.
Platforms: Windows
| License: Shareware | Cost: $25.00 USD | Size: 1.69 MB | Download (158): Graph Plotter Download |
Released: June 03, 2016
|
Added: July 19, 2016 | Visits: 1.544
 Visual Complex is a graph software to create graph of complex function. 3D function graphs and 2D color maps can be created with this grapher. You can input complex functions in the form of w=f(z) (where z=x+yi) directly before creacting graphs. Graphs can be copied and saved in the format of...
Platforms: Windows, Windows 7, Windows Server
| License: Demo | Cost: $30.00 USD | Size: 1.86 MB | Download (156): Visual Complex Download |
Released: June 30, 2010
|
Added: July 03, 2010 | Visits: 1.717
 A handy, fast, reliable, precise tool if you need to perform complex mathematical calculations. Scientific Calculator Precision 72 is programmed in C#. All calculations are done in proprietary data type. The calculator handles mathematical formulas of any length and complexity. Calculation...
Platforms: Windows
| License: Shareware | Cost: $30.00 USD | Size: 2.64 MB | Download (154): Scientific Calculator Precision 72 Download |
Added: January 07, 2010 | Visits: 1.272
GD::Graph::Polar is a Perl module to make polar graph using GD package. SYNOPSIS use GD::Graph::Polar; my $obj=GD::Graph::Polar->new(size=>480, radius=>100); $obj->addPoint (50=>25); $obj->addPoint_rad (50=>3.1415); $obj->addGeoPoint (75=>25); $obj->addGeoPoint_rad (75=>3.1415);...
Platforms: *nix
| License: Freeware | Size: 47.1 KB | Download (152): GD::Graph::Polar Download |
Added: September 03, 2010 | Visits: 2.140
SVG::Graph is a Perl module to visualize your data in Scalable Vector Graphics (SVG) format. SYNOPSIS use SVG::Graph; use SVG::Graph::Data; use SVG::Graph::Data::Datum; #create a new SVG document to plot in... my $graph = SVG::Graph->new(width=>600,height=>600,margin=>30); #and create...
Platforms: *nix
| License: Freeware | Size: 88.06 KB | Download (151): SVG::Graph Download |
Added: August 08, 2008 | Visits: 1.559
 Graph Control w/design support .NET Compact Framework Features: L Excellent information display tool L Resizable (design and runtime) L Royalty FREE software integration L Purchased product includes sample code (VB and C#) L Purchased product includes two .dll's, one for design time and one...
Platforms: .NET Compact Framework
| License: Demo | Cost: $24.95 USD | Size: 16 KB | Download (143): Graph Control Download |
Added: November 04, 2010 | Visits: 1.704
Python Web Graph Generator is a threaded Web graph (Power law random graph) generator. It can generate a synthetic Web graph of about one million nodes in a few minutes on a desktop machine. This software implements a threaded variant of the RMAT algorithm. A little tweak can produce graphs...
Platforms: *nix
| License: Freeware | Size: 614.4 KB | Download (142): Python Web Graph Generator Download |
Released: May 13, 2011
|
Added: May 23, 2011 | Visits: 1.308
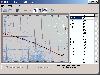 Graph Converter Lite Convert all existing paper charts and diagrams to electronic form with this
easy to learn program. Just scan the graph, open the image in Graph Converter Lite, calibrate, and the modern algorithm for automatic graphs recognition creates the tables automatically. May be...
Graph Converter Lite Convert all existing paper charts and diagrams to electronic form with this
easy to learn program. Just scan the graph, open the image in Graph Converter Lite, calibrate, and the modern algorithm for automatic graphs recognition creates the tables automatically. May be...
Platforms: Windows
| License: Freeware | Size: 1.92 MB | Download (141): Graph Converter Lite Download |
Added: July 10, 2010 | Visits: 1.789
GD::Graph::Thermometer is a Perl module to generate progress graph on the fly. SYNOPSIS use GD::Graph::Thermometer; my $result = GD::Graph::Thermometer->new({ image_path => /path/to/image.png, type => png, goal => 80000, current => 20000, title => Funding the League for the Year ($),...
Platforms: *nix
| License: Freeware | Size: 7.17 KB | Download (138): GD::Graph::Thermometer Download |
Released: July 10, 2004
|
Added: March 07, 2006 | Visits: 3.658
 This 2D / 3D Horizontal Bar Graph provides both a client and server side solution for the incorporation of bar graphs into web pages. It provides versatile components so that web authors and Java developers can easily build and publish dynamic and interactive bar graphs. We have built in many...
Platforms: DOS, OS/2, Windows, Mac, *nix, Windows CE
| License: Shareware | Cost: $49.00 USD | Size: 308 KB | Download (131): 2D/3D Horizontal Bar Graph Software Download |
Added: August 02, 2008 | Visits: 1.947
 Complex Grapher is a graphing calculator to create a graph of complex function. 3D function graphs and 2D color maps can be created with this grapher. You can input complex functions in the form of w=f(z) (where z=x+yi) directly before creacting graphs. Graphs can be copied and saved in the...
Platforms: Windows
| License: Demo | Cost: $19.95 USD | Size: 1.89 MB | Download (131): Complex Grapher Download |
Added: January 16, 2010 | Visits: 993
Lybniz project is a simple function graph plotter in Python on GTK. Lybniz allows to plot up to three functions on one graph. It needs no installation - simply one Python script..
Platforms: *nix
| License: Freeware | Size: 12.29 KB | Download (127): Lybniz Download |
Added: August 20, 2008 | Visits: 1.125
 Graph Digitizer Scout automatically converts hard-copy graphs, oscillograms, charts, plots, into X,Y. Different recognition methods including manual correction mode. Data can be exported to Excel, CSV format and other applications.
Platforms: Windows
| License: Demo | Cost: $35.00 USD | Size: 5.21 MB | Download (126): Graph Digitizer Scout Download |
Added: August 19, 2008 | Visits: 1.220
 Bar Graph MDI browses the web using GRML. GRML splits file and web page content into a form AND a view. The form is used for input controls, to handle user input for web requests. The view is used for display controls to show web page results. The results are dsplayed using 6 different graphs....
Platforms: Windows
| License: Freeware | Size: 1.31 MB | Download (126): Bar Graph MDI Download |
Added: November 07, 2010 | Visits: 1.918
PostScript::Graph::Bar Perl module can draw a bar chart on a postscript file. SYNOPSIS Simplest Take labels and values from a csv file and output as a bar chart on a postscript file. use PostScript::Graph::Bar; my $bar = new PostScript::Graph::Bar(); $bar->build_chart("survey.csv");...
Platforms: *nix
| License: Freeware | Size: 55.3 KB | Download (125): PostScript::Graph::Bar Download |