


Graph And Plot Digitizer Digitizing software
Graph And Plot Digitizer Digitizing
Added: August 29, 2013 | Visits: 364
 This program calculates and plot the Microorganism population through the time.
Platforms: Matlab
This program calculates and plot the Microorganism population through the time.
Platforms: Matlab
| License: Freeware | Size: 10 KB | Download (45): Thermal reduction time Download |
Added: June 08, 2013 | Visits: 492
Enter the coefficients for the Ax2 + Bx + C = 0 equation and Quadratic Equation will output the solutions and plot(if they are not imaginary).
Platforms: Matlab
| License: Shareware | Cost: $0.00 USD | Size: 10 KB | Download (46): Quadratic Equation Calculator Download |
Added: April 16, 2013 | Visits: 242
Simulate a Galton-Watson branching process using SPARFUN toolbox and plot it as a tree. We modified function TREEPLOT to plot the leaves in their respective level. See http://www.math.uu.se/research/telecom/software/
Platforms: Matlab
| License: Shareware | Cost: $0.00 USD | Size: 10 KB | Download (48): Random trees Download |
Added: July 30, 2013 | Visits: 343
The files in this folder contains small routines for MATLAB to compute and plot triangular probability denstity function. There are following 4 files:tglpdf : Compute and plot triangular probability density function for given value of X (X can be scalar or matrix)tglcdf : Compute and plot...
Platforms: Matlab
| License: Shareware | Cost: $0.00 USD | Size: 10 KB | Download (43): Triangular pdf Download |
Added: August 25, 2013 | Visits: 347
Calculate and plot BER curve against SNR for BPSK Modulation in Gaussian Environment.It calculates 100 errors to Calculate BER for every SNR value to ensure better approximation.I hope that this help students of signal processing and communications alot.
Platforms: Matlab
| License: Shareware | Cost: $0.00 USD | Size: 10 KB | Download (47): BER Curve for BPSK in Gaussian Environment Download |
Added: August 31, 2013 | Visits: 382
rhist is extension of MATLAB hist function to compute and plot relative frequency and density.N = HIST(Y) bins the elements of Y into 10 equally spaced containers and returns the relative frequency of elements in each container. If Y is amatrix, RHIST works down the columns.N = RHIST(Y,M), where...
Platforms: Matlab
| License: Shareware | Cost: $0.00 USD | Size: 10 KB | Download (43): rhist Download |
Added: June 02, 2013 | Visits: 509
The function circumcircle takes input as the coordinates of the three vertices of a triangle and compute the circum center and circum radius by using the formula in terms of the length of sides and area of triangle and plot the circumcircle.
Platforms: Matlab
| License: Shareware | Cost: $0.00 USD | Size: 10 KB | Download (45): Circumcircle of a triangle Download |
Added: September 05, 2013 | Visits: 258
Creates a graph and a data table below it. the table is put in an activex control using the column labels colheadNOTE: TO SEE AN EXAMPLE OF HOW TO USE THE MICROSOFT SPREADSHEET OBJECT, WHICH ALLOWS INPUTS AS WELL AS CALCULATIONS, SEE MY EXAMPLE CALLED "SPREADSHEET.M" WHICH IS AVAILABLE ON THE...
Platforms: Matlab
| License: Shareware | Cost: $0.00 USD | Size: 10 KB | Download (48): graph_and_table_ Download |
Added: June 13, 2013 | Visits: 354
Use this application to compute and plot hazard spectra. This can be done for either probabilistic spectra (for a specified IMR, ERF, and Site), or for deterministic spectra (for a specified IMR, Source, and Site).
Platforms: Mac
| License: Shareware | Cost: $0.00 USD | Size: 25.67 MB | Download (36): Hazard Spectrum Calculator Download |
Added: October 20, 2013 | Visits: 361
Use this application to compute and plot Scenario ShakeMaps for a chosen IMR , Earthquake Rupture, and Geographic Region.
Platforms: Mac
| License: Shareware | Cost: $0.00 USD | Size: 25.66 MB | Download (45): Scenario ShakeMap Download |
Added: November 09, 2013 | Visits: 377
Use this application to compute and plot hazard spectra. This can be done for either probabilistic spectra (for a specified IMR, ERF, and Site), or for deterministic spectra (for a specified IMR, Source, and Site).
Platforms: Mac
| License: Shareware | Cost: $0.00 USD | Size: 15.56 MB | Download (45): Hazard Spectrum Server Download |
Added: October 05, 2013 | Visits: 524
The Lost Amulet is a text-based RPG similar in style and plot to The Colossal Cave Adventure. You must enter the ruins of a castle to retrieve a lost artifact, the Amulet of Vigour. Features: * Text based RPG in Python 2.6 * Addictive & challenging adventure * Simple, well-explained...
Platforms: Mac
| License: Freeware | Size: 10.24 KB | Download (44): The Lost Amulet Download |
Added: July 03, 2013 | Visits: 455
Use this application to compute and plot Scenario ShakeMaps for a chosen IMR , Earthquake Rupture, and Geographic Region.
Platforms: Mac
| License: Freeware | Size: 15.55 MB | Download (37): Scenario ShakeMap Server Download |
Added: July 04, 2013 | Visits: 256
Monitor and plot 2 or 3 PV scalars using the XAL channel correlator.*
Platforms: Mac
| License: Shareware | Cost: $0.00 USD | Size: 10.24 KB | Download (35): XYZ Correlator Download |
Added: July 22, 2010 | Visits: 1.309
Engauge Digitizer project is digitizing software that converts an image showing a graph or map into numbers. The image file can come from a scanner, digital camera, or screenshot. The numbers can be read on the screen, and written or copied to a spreadsheet. Highlights for beginners include an...
Platforms: *nix
| License: Freeware | Size: 9.1 MB | Download (179): Engauge Digitizer Download |
Added: October 14, 2010 | Visits: 1.658
GD::Graph is a graph plotting module for Perl 5. SYNOPSIS use GD::Graph::moduleName; GD::Graph is a perl5 module to create charts using the GD module. The following classes for graphs with axes are defined: GD::Graph::lines Create a line chart. GD::Graph::bars and GD::Graph::hbars...
Platforms: *nix
| License: Freeware | Size: 143.36 KB | Download (111): GD::Graph Download |
Released: August 09, 2002
|
Added: October 17, 2006 | Visits: 5.461
Master Graph is easy-to-use graphing, curve fitting software.
Support three types of graphs (Cartesian, polar and parametric functions).
Complete tuning of appearance of the graphs and coordinate system (various
colours, styles of lines and points). Support the Office XP style for toolbars...
Platforms: Windows
| License: Shareware | Cost: $20.00 USD | Size: 604 KB | Download (351): AMaster Graph Download |
Added: March 17, 2006 | Visits: 7.153
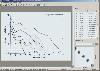 Program for digitizing XY graphs and maps. Both automatic and manual digitizing. Supported graphics formats are TIFF, JPEG, BMP, and PCX. Allows to save current workspace and return to unfinished work later. Obtained digital data may be copied to the clipboard (and then pasted into e.g. MS Excel)...
Platforms: Windows
Program for digitizing XY graphs and maps. Both automatic and manual digitizing. Supported graphics formats are TIFF, JPEG, BMP, and PCX. Allows to save current workspace and return to unfinished work later. Obtained digital data may be copied to the clipboard (and then pasted into e.g. MS Excel)...
Platforms: Windows
| License: Shareware | Cost: $30.00 USD | Size: 1.05 MB | Download (521): GetData Download |
Added: November 22, 2006 | Visits: 4.585
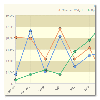
 Rt-Plot is a tool to generate Cartesian X/Y-plots from scientific data. You can enter and calculate tabular data. View the changing graphs, including linear and non linear regression, interpolation, differentiation and integration, during entering. Rt-Plot enables you to create plots fast and...
Platforms: Windows
Rt-Plot is a tool to generate Cartesian X/Y-plots from scientific data. You can enter and calculate tabular data. View the changing graphs, including linear and non linear regression, interpolation, differentiation and integration, during entering. Rt-Plot enables you to create plots fast and...
Platforms: Windows
| License: Shareware | Cost: $50.00 USD | Size: 5.56 MB | Download (195): Rt-Plot Download |
Released: October 10, 2011
|
Added: November 10, 2011 | Visits: 871
 Add Powerful reporting features to your Web / Intranet pages and applications.
With the advanced graphing functionality you will be quickly adding impressive
and dynamic charting capabilities bringing your data alive !
The graphing software is completely self contained within a single...
Platforms: Windows, Mac, *nix, Pocket PC, Android,BlackBerry,iPhone,iPod,iTouch,Java
Add Powerful reporting features to your Web / Intranet pages and applications.
With the advanced graphing functionality you will be quickly adding impressive
and dynamic charting capabilities bringing your data alive !
The graphing software is completely self contained within a single...
Platforms: Windows, Mac, *nix, Pocket PC, Android,BlackBerry,iPhone,iPod,iTouch,Java
| License: Shareware | Cost: $195.00 USD | Size: 240.52 KB | Download (93): Active Graphs and Charts Download |