


Geospatial Visualization software
Geospatial Visualization
Released: October 21, 2011
|
Added: April 24, 2012 | Visits: 696
 For military, reconnaissance and intelligence agencies, the accuracy of geospatial visualization and analysis is a matter of security. PerfectEPD display calibration software calibrates and verifies professional displays for geospatial image viewing, allowing to see greater detail and get more...
Platforms: Windows, Mac
For military, reconnaissance and intelligence agencies, the accuracy of geospatial visualization and analysis is a matter of security. PerfectEPD display calibration software calibrates and verifies professional displays for geospatial image viewing, allowing to see greater detail and get more...
Platforms: Windows, Mac
| License: Demo | Cost: $489.00 USD | Size: 50.04 MB | Download (99): PerfectEPD Download |
Added: June 25, 2010 | Visits: 1.027
 XMMS Root Visualization Plugin is a little XMMS plugin wich can draw a spectrum analyzer directly to the background (root window) of X. Whats New in This Release: - changed code to get rid of gcc 4 compiler warnings - added alpha channel to all colors - rewrote configuration backend -...
Platforms: *nix
XMMS Root Visualization Plugin is a little XMMS plugin wich can draw a spectrum analyzer directly to the background (root window) of X. Whats New in This Release: - changed code to get rid of gcc 4 compiler warnings - added alpha channel to all colors - rewrote configuration backend -...
Platforms: *nix
| License: Freeware | Size: 337.92 KB | Download (108): XMMS Root Visualization Plugin Download |
Released: July 01, 2012
|
Added: July 01, 2012 | Visits: 788
Visualization in Geometric Knot Theory is a small, Java based application specially designed to help you create different interactive visualizations in geometric knot theory.
Most of the software's options are available via the context menu of corresponding components and their toolbars and...
Platforms: Windows
| License: Freeware | Download (422): Visualization in Geometric Knot Theory Download |
Released: September 27, 2012
|
Added: September 27, 2012 | Visits: 825
 The Visualization Toolkit (VTK) is an open-source, freely available software system for 3D computer graphics, image processing and visualization. VTK consists of a C++ class library and several interpreted interface layers including Tcl/Tk, Java, and Python. Kitware, whose team created and...
Platforms: Windows, Mac, Linux
The Visualization Toolkit (VTK) is an open-source, freely available software system for 3D computer graphics, image processing and visualization. VTK consists of a C++ class library and several interpreted interface layers including Tcl/Tk, Java, and Python. Kitware, whose team created and...
Platforms: Windows, Mac, Linux
| License: Freeware | Size: 10 MB | Download (54): Visualization Toolkit (VTK) Download |
Released: August 20, 2012
|
Added: August 20, 2012 | Visits: 860
 Power Engineering Visualization VC++ Source Code Solutions
UCanCode Softwareis a world-class Power Engineering Solutions provider with an established reputation for customer responsiveness and technical expertise. Our solutions stand behind thousands of T&D projects in over 40 countries around...
Platforms: Windows
Power Engineering Visualization VC++ Source Code Solutions
UCanCode Softwareis a world-class Power Engineering Solutions provider with an established reputation for customer responsiveness and technical expertise. Our solutions stand behind thousands of T&D projects in over 40 countries around...
Platforms: Windows
| License: Freeware | Size: 491.52 KB | Download (48): Power Engineer Visualization Component Download |
Released: October 20, 2012
|
Added: October 20, 2012 | Visits: 591
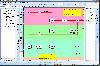 PMN Solution Visualization .NET/VC++ Source Code Kit
-- Build Advanced Diagrams and Dashboards for Business Process Management (BPM) in minutes
Business Process Modeling (BPM) is typically performed by business analysts who are seeking to improve process efficiency. Process oriented...
Platforms: Windows
PMN Solution Visualization .NET/VC++ Source Code Kit
-- Build Advanced Diagrams and Dashboards for Business Process Management (BPM) in minutes
Business Process Modeling (BPM) is typically performed by business analysts who are seeking to improve process efficiency. Process oriented...
Platforms: Windows
| License: Freeware | Size: 491.52 KB | Download (49): UCC BPMN Visualization Component Download |
Added: April 26, 2013 | Visits: 782
The code in this submission describes how to download and install the Visualization Toolkit (VTK, www.vtk.org) and create a MATLAB mex file to interface with it.An example C++ mex file and code to build and run the mex file are included.
Platforms: Matlab
| License: Freeware | Size: 10 KB | Download (46): Visualization Toolkit (VTK) mex interface Download |
Added: August 11, 2013 | Visits: 431
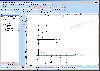
Alternate checkerboard visualization of 2 RGB images out=checkvis(im1, im2, sqsize) im1, im2 ... RGB source images, MUST have same size! sqsize ... square side size (optional agument, default is 32pixels)
Platforms: Matlab
| License: Shareware | Cost: $0.00 USD | Size: 10 KB | Download (42): Alternate checkerboard visualization of 2 RGB images Download |
Added: August 16, 2013 | Visits: 608
This is the data set you will need to participate in the Data Visualization contest. For more information, refer to the rules posted here. http://www.mathworks.com/contest/datavis/rules.htmlYou can also follow the latest announcements on the contest blog here. http://blogs.mathworks.com/contest/
Platforms: Matlab
| License: Freeware | Size: 1.3 MB | Download (48): MATLAB Contest - Data Visualization Download |
Added: August 08, 2013 | Visits: 383
In this code, I show how to create a clean architecture for a volume visualization engine and one example GUI that uses it. I take advantage of exporting nested functions so the GUI programmer can manipulate the visualization in ways that can be customized for specific applications.Scott, Mike...
Platforms: Matlab
| License: Shareware | Cost: $0.00 USD | Size: 10 KB | Download (44): Volume Visualization Example Download |
Added: August 10, 2008 | Visits: 1.310
 The KineticaRT .NET Bitmap Visualization Control is fast, easy to configure and supports live update (state changes are transferred automatically to/from the connected channel) and is ideal for mimic diagrams and value indicators. It is a member of the KineticaRT family of components, which can...
Platforms: Windows
The KineticaRT .NET Bitmap Visualization Control is fast, easy to configure and supports live update (state changes are transferred automatically to/from the connected channel) and is ideal for mimic diagrams and value indicators. It is a member of the KineticaRT family of components, which can...
Platforms: Windows
| License: Commercial | Cost: $90.00 USD | Size: 456 KB | Download (100): .NET Visualization Tools - KineticaRT Bitmap Control Download |
Added: August 20, 2008 | Visits: 1.583
 KineticaRT .NET Multi-Needle 2D XY Graph Visualization Component, in common with other KineticaRT components, is easy to configure and supports live update (state changes are transferred automatically to/from the connected channel). It is a member of the KineticaRT family of components, which can...
Platforms: Windows
KineticaRT .NET Multi-Needle 2D XY Graph Visualization Component, in common with other KineticaRT components, is easy to configure and supports live update (state changes are transferred automatically to/from the connected channel). It is a member of the KineticaRT family of components, which can...
Platforms: Windows
| License: Commercial | Cost: $90.00 USD | Size: 293 KB | Download (113): KineticaRT 2D XY Graph .NET Visualization Component Download |
Added: August 14, 2008 | Visits: 3.159
Open Visualization Data Explorer is a visualization framework that gives users the ability to apply advanced visualization and analysis techniques to their data. These techniques can be applied to help users gain new insights into data from applications in a wide variety of fields including...
Platforms: All
| License: Freeware | Size: 7.6 MB | Download (783): Open Visualization Data Explorer Download |
Added: January 25, 2010 | Visits: 728
GRASS GIS, commonly referred to as GRASS (Geographic Resources Analysis Support System), is a Geographic Information System (GIS) used for geospatial data management and analysis, image processing, graphics/maps production, spatial modeling, and visualization. GRASS is currently used in academic...
Platforms: Mac
| License: Freeware | Download (116): GRASS GIS Download |
Released: June 21, 2012
|
Added: June 21, 2012 | Visits: 913
 Commonly referred to as GRASS, this is a free Geographic Information System (GIS) used for geospatial data management and analysis, image processing, graphics/maps production, spatial modeling, and visualization. GRASS is currently used in academic and commercial settings around the world, as...
Platforms: Mac
Commonly referred to as GRASS, this is a free Geographic Information System (GIS) used for geospatial data management and analysis, image processing, graphics/maps production, spatial modeling, and visualization. GRASS is currently used in academic and commercial settings around the world, as...
Platforms: Mac
| License: Freeware | Size: 59 MB | Download (57): Grass GIS for Mac OS X Download |
Released: October 09, 2012
|
Added: October 09, 2012 | Visits: 748
 Data Visualization is a free generic cross platform tool that allows the user to create documents in an easy way. You can easily create layout of the document and import data from almost any data base (Oracle, MySQL, PostgreSQL, Firebird, MS SQL Server, IBM DB2, Interbase, SQLite) or from...
Platforms: Windows, Mac, Java, Linux, Linux Gnome, Linux GPL, Linux Open Source, MS-DOS, Unix, Other
Data Visualization is a free generic cross platform tool that allows the user to create documents in an easy way. You can easily create layout of the document and import data from almost any data base (Oracle, MySQL, PostgreSQL, Firebird, MS SQL Server, IBM DB2, Interbase, SQLite) or from...
Platforms: Windows, Mac, Java, Linux, Linux Gnome, Linux GPL, Linux Open Source, MS-DOS, Unix, Other
| License: Freeware | Size: 14.84 MB | Download (52): Data Visualization Download |
Released: November 02, 2012
|
Added: November 02, 2012 | Visits: 391
 3DGeoStats is a three dimensional, interactive visualization of the earth showing arbitrary statistical data. The data connected to geo coordinates is represented as markers. The component is a pure Actionscript 3 Library with an API. The sample above shows only the basic use of the component....
Platforms: Windows, Mac, Other, Pocket PC, Android, BlackBerry, iPhone, iPod, iTouch, Palm
3DGeoStats is a three dimensional, interactive visualization of the earth showing arbitrary statistical data. The data connected to geo coordinates is represented as markers. The component is a pure Actionscript 3 Library with an API. The sample above shows only the basic use of the component....
Platforms: Windows, Mac, Other, Pocket PC, Android, BlackBerry, iPhone, iPod, iTouch, Palm
| License: Commercial | Cost: $34.00 USD | Size: 4.88 MB | Download (53): 3DGeoStats - a 3D Data Visualization Download |
Released: July 07, 2012
|
Added: July 07, 2012 | Visits: 529
 The Business Continuity Visualization Toolkit assists in the assessment of Business Continuity projects and helps to translate dry technical relationships into colorful pictures suitable for management presentations and board decisions.
Platforms: Windows, Mac, Linux
The Business Continuity Visualization Toolkit assists in the assessment of Business Continuity projects and helps to translate dry technical relationships into colorful pictures suitable for management presentations and board decisions.
Platforms: Windows, Mac, Linux
| License: Freeware | Size: 1023.5 KB | Download (45): Business Continuity Visualization Tool Download |
Released: July 24, 2012
|
Added: July 24, 2012 | Visits: 565
The Comics project allows local downloading and visualization of comics found on the web.
Platforms: Windows, Mac, Linux
| License: Freeware | Size: 39.63 KB | Download (45): Comics visualization project Download |
Released: October 13, 2012
|
Added: October 13, 2012 | Visits: 361
The Graph Visualization Framework is a set of Java 2 packages that canserve as a foundation for applications that manipulate or visualize graph structures. 'Royere' is built on the GVF and includes XMLsupport, SVG output, pluggable layouts, editing.
Platforms: Windows, Mac, Linux
| License: Freeware | Size: 5.4 MB | Download (44): Graph Visualization Framework Download |