


Data Visualization software
Data Visualization
Released: August 09, 2012
|
Added: August 09, 2012 | Visits: 353
 CView is a data visualization tool which can be used to display 3D graphics for any. Specific users include the developers at the supercomputer facility in the Department of Energy's national laboratory: Pacific Northwest National Laboratory.
This is the binary package repository for many...
CView is a data visualization tool which can be used to display 3D graphics for any. Specific users include the developers at the supercomputer facility in the Department of Energy's national laboratory: Pacific Northwest National Laboratory.
This is the binary package repository for many...
Platforms: Windows, Mac, Linux
| License: Freeware | Size: 38.66 MB | Download (51): CView Binary Packages Download |
Released: October 17, 2012
|
Added: October 17, 2012 | Visits: 370
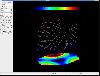 FMesh is a simply scientific data visualization tool based on OpenGL. FMesh can generate 2D and 3D graph of contour and color maps for any (x,y,z) scattered data set, many other options are included.
Platforms: Windows, Mac, BSD, Linux
| License: Freeware | Size: 329.53 KB | Download (51): FMesh Download |
Released: October 04, 2012
|
Added: October 04, 2012 | Visits: 314
GenoViz provides software applications and re-usable components for genomics data visualization and data sharing. One included project is IGB: the Integrated Genome Browser. Documentation is available from http://sourceforge.net/apps/trac/genoviz/
Platforms: Windows, Mac, BSD, Linux
| License: Freeware | Size: 22.95 MB | Download (56): GenoViz Download |
Released: September 26, 2012
|
Added: September 26, 2012 | Visits: 313
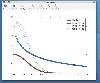 Simple OS X 'droplet' for quick data visualization. Drag-and-drop one or more text files containing series data and a simple scatter plot is generated containing each series with different symbols, legend, etc. GUI-less alternative to gnome PlotDrop.
Platforms: Mac
| License: Freeware | Size: 9.03 KB | Download (45): PlotDroppy Download |
Added: April 27, 2013 | Visits: 307
The choice of colormaps for data visualization can affect the information accessible to color-blind users. For example large patches of cyan in an image with a bitonal cyan-magenta colormap (Matlab's "cool") might become invisible to Protanopes if displayed on white background.
Platforms: Matlab
| License: Shareware | Cost: $0.00 USD | Size: 30.72 KB | Download (43): Matlab colormaps as seen by color-blind users Download |
Released: October 03, 2014
|
Added: October 13, 2014 | Visits: 1.025
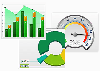
 Shield UI Chart is feature rich and facilitates the creation of visually impressive charts and sharp graphics. The Chart control has many built-in features, which cover many of the common data visualization scenarios. The control is lightweight and fast. This allows for combining visual appeal...
Platforms: Windows, Mac, *nix, Windows 8, Windows Phone, Windows 7, Windows Server, iOS, Android, Symbian, Pocket PC, OpenVMS, Handheld, Other,BlackBerry,iPhone,iPod,iPad,iTouch,Palm,Netware,Java,
| License: Shareware | Cost: $399.00 USD | Size: 1.8 MB | Download (68): JavaScript Chart Standard Download |
Added: October 15, 2013 | Visits: 412
* The JetChart Library is a Java chart and graph class library that encompasses a wide range of functionalities aimed at data visualization and analysis, in the form of different types of Java charts and graphs. * Several types of Java charts are supported, as line charts, bar charts, pie...
Platforms: Mac
| License: Shareware | Cost: $100.00 USD | Size: 5.52 MB | Download (42): JetChart Download |
Added: September 30, 2013 | Visits: 254
SAOImage DS9 is an astronomical imaging and data visualization application. DS9 supports FITS images and binary tables, multiple frame buffers, region manipulation, and many scale algorithms and colormaps. It provides for easy communication with external analysis tasks and is highly configurable...
Platforms: *nix
| License: Freeware | Size: 10.76 MB | Download (43): SAOImage DS9 for Linux Download |
Added: August 28, 2013 | Visits: 602
Diversity Maps is a data visualization tool for plant geneticists and breeders. It generates publication-quality, vector-based chromosome maps displaying differences in marker states between individuals. Features Displays haplotype similarity by color; Sorts accessions automatically to...
Platforms: *nix
| License: Freeware | Size: 4.24 MB | Download (33): Diversity Maps For Linux Download |
Added: June 28, 2013 | Visits: 375
FMesh is a simply scientific data visualization tool based on OpenGL. FMesh can generate 2D and 3D graph of contour and color maps for any (x,y,z) scattered data set, many other options are included.
Platforms: *nix
| License: Freeware | Size: 337.92 KB | Download (36): FMesh Download |
Added: November 02, 2013 | Visits: 276
This is the homepage of the profiling tool Callgrind and the profile data visualization KCachegrind. Both are licensed under GPL V2. Callgrind uses runtime instrumentation via the Valgrind framework for its cache simulation and call-graph generation. This way, even shared libraries and...
Platforms: *nix
| License: Shareware | Cost: $0.00 USD | Size: 286.72 KB | Download (42): KCachegrind Download |
Released: October 27, 2016
|
Added: November 03, 2016 | Visits: 1.360
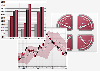
 Nevron Data Visualization technology for Microsoft SQL Server Reporting Services is designed to deliver exceptional enhancements to your reports in both SSRS 2005 and SSRS 2008. It provides the needed flexibility and enterprise feature set, ensuring that your reports are making the visual...
Platforms: Windows, Windows 8, Windows 7, Windows Server
| License: Shareware | Cost: $1239.00 USD | Size: 182.21 MB | Download (67): Nevron Vision for SSRS Download |
Released: September 16, 2015
|
Added: October 06, 2015 | Visits: 755
 Nevron Data Visualization technology for Microsoft SharePoint 2007 and 2010 (MOSS and WSS) is designed to provide exceptional reporting and dashboarding features to SharePoint users and IT Professionals. The web parts included in the suite are configured visually and directly in SharePoint...
Platforms: Windows, Windows 8, Windows 7, Windows Server
| License: Shareware | Cost: $1699.00 USD | Size: 99.87 MB | Download (49): Nevron Vision for SharePoint Download |
Released: August 07, 2019
|
Added: September 02, 2019 | Visits: 75.593
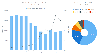 AnyChart is a robust and superfast JavaScript charting library to add great-looking, interactive HTML5 charts into any project, in any browser, and on any platform/OS including mobile ones.
AnyChart provides advanced customization and flexibility opportunities, no matter if you are developing...
AnyChart is a robust and superfast JavaScript charting library to add great-looking, interactive HTML5 charts into any project, in any browser, and on any platform/OS including mobile ones.
AnyChart provides advanced customization and flexibility opportunities, no matter if you are developing...
Platforms: Windows, Mac, *nix, Windows 8, Windows 7, Windows Server, iOS, Android, iPhone,iPad
| License: Shareware | Cost: $49.00 USD | Size: 17.81 MB | Download (1228): AnyChart JS Charts and Dashboards Download |
Released: August 08, 2019
|
Added: September 14, 2019 | Visits: 3.788
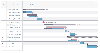 AnyGantt JS Gantt Charts library is an advanced JavaScript-based data visualization solution, allowing everyone to utilize power of animation and ultimate interactivity. AnyGantt is perfect for building complex and informative HTML5 Gantt charts.
AnyGantt is fully cross-browser and...
AnyGantt JS Gantt Charts library is an advanced JavaScript-based data visualization solution, allowing everyone to utilize power of animation and ultimate interactivity. AnyGantt is perfect for building complex and informative HTML5 Gantt charts.
AnyGantt is fully cross-browser and...
Platforms: Windows, Mac, *nix, Windows 8, Windows 7, Windows Server, iOS, Android, iPhone,iPad
| License: Shareware | Cost: $49.00 USD | Size: 17.81 MB | Download (1206): AnyGantt JS Gantt Charts Download |
Released: August 02, 2012
|
Added: August 02, 2012 | Visits: 630
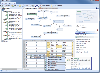 Atlantis Data Surf is our SQL visualization tool - it is a free animated graphing tool which allows you to easily visualize complex schemas - use it to "surf" through your data. At the heart of Data Surf is the "Surf Graph", automatically picking the most optimal layout, it allows one-click...
Platforms: Windows
| License: Freeware | Size: 5.86 MB | Download (47): Atlantis Data Surf Download |
Released: June 12, 2012
|
Added: June 12, 2012 | Visits: 485
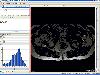
 MITK 3M3 is a free and user-friendly application which ensures effective and efficient work, analysis, and visualization of radiological image data.
MITK 3M3 gives you access to the latest algorithms and methods from research. The cooperation between the German Cancer Research Center (DKFZ)...
MITK 3M3 is a free and user-friendly application which ensures effective and efficient work, analysis, and visualization of radiological image data.
MITK 3M3 gives you access to the latest algorithms and methods from research. The cooperation between the German Cancer Research Center (DKFZ)...
Platforms: Mac
| License: Freeware | Size: 41.3 MB | Download (418): MITK 3M3 for Mac OS X Download |
Released: November 24, 2012
|
Added: November 24, 2012 | Visits: 490
 MITK 3M3 is a free and user-friendly application which ensures effective and efficient work, analysis, and visualization of radiological image data.
MITK 3M3 gives you access to the latest algorithms and methods from research. The cooperation between the German Cancer Research Center (DKFZ)...
MITK 3M3 is a free and user-friendly application which ensures effective and efficient work, analysis, and visualization of radiological image data.
MITK 3M3 gives you access to the latest algorithms and methods from research. The cooperation between the German Cancer Research Center (DKFZ)...
Platforms: Windows
| License: Freeware | Size: 41.3 MB | Download (505): MITK 3M3 Download |
Released: July 09, 2012
|
Added: July 09, 2012 | Visits: 405
TableView is a small, simple application specially designed to help you with the visualization of genomic data.
TableView can present data in spreadsheet format, which lets you sort, copy and paste rows, etc.
It also lets you view scatter plots comparing columns in the spreadsheet. And when...
Platforms: Windows
| License: Freeware | Download (411): TableView Download |
Released: August 05, 2012
|
Added: August 05, 2012 | Visits: 395
 Gitools, is a framework for analysis and visualization of genomic data. Data and results are represented as browsable heatmaps. Gitools allows to import data directly from IntOGen and Biomart.
Platforms: Windows
| License: Freeware | Size: 26.2 MB | Download (440): GiTools Download |