


Data Point Capturing software
Data Point Capturing
Added: April 21, 2013 | Visits: 511
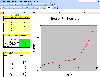
 GUI to move a selected data point upward or downward by a user-defined amount% Input: nfig -- the number of the figure% Use: 1. push the "Select" button% 2. move the mouse unto th figure to select a data point to be% moved% 3. push "Up" or "Down" button to move the data point% 4. push "Undo"...
Platforms: Matlab
GUI to move a selected data point upward or downward by a user-defined amount% Input: nfig -- the number of the figure% Use: 1. push the "Select" button% 2. move the mouse unto th figure to select a data point to be% moved% 3. push "Up" or "Down" button to move the data point% 4. push "Undo"...
Platforms: Matlab
| License: Freeware | Size: 10 KB | Download (43): GUI for manipulating data in a figure Download |
Released: October 27, 2012
|
Added: October 27, 2012 | Visits: 800
 A file finding and text searching tool: * Regular expression text search * High performance search algorithm * Wildcard and regular expression file search * Recursive directory search * Real-time file viewer to see search results in context * Tabs for convenient access to files recently viewed *...
Platforms: Windows
A file finding and text searching tool: * Regular expression text search * High performance search algorithm * Wildcard and regular expression file search * Recursive directory search * Real-time file viewer to see search results in context * Tabs for convenient access to files recently viewed *...
Platforms: Windows
| License: Shareware | Cost: $35.00 USD | Size: 307.2 KB | Download (415): BareGrepPro Download |
Released: July 13, 2012
|
Added: July 13, 2012 | Visits: 982
 A free file finding and text searching tool: * Regular expression text search * High performance search algorithm * Wildcard and regular expression file search * Recursive directory search * Save, name and manage text search patterns * Interactive, incremental search * Extract data with capturing...
Platforms: Windows
A free file finding and text searching tool: * Regular expression text search * High performance search algorithm * Wildcard and regular expression file search * Recursive directory search * Save, name and manage text search patterns * Interactive, incremental search * Extract data with capturing...
Platforms: Windows
| License: Freeware | Size: 245.76 KB | Download (417): BareGrep Download |
Added: August 22, 2013 | Visits: 328
Plots each data point as a box, and puts each box on the graph in such a way that no boxes overlap. By default produces a standalone plot in a new figure window, but can plot into specified axes as well. See the comments in the function help for more detail.
Platforms: Matlab
| License: Shareware | Cost: $0.00 USD | Size: 10 KB | Download (41): Generate a Dotplot Download |
Added: January 11, 2010 | Visits: 1.001
Time::Skew is a Perl module that computes local clock skew with respect to a remote clock. SYNOPISI use Time::Skew # Init Convex Hull and timing data my $hull=[]; my $result={}; # Iterate data point introduction Time::Skew::convexhull($result,$datapoint,$hull); This module supports...
Platforms: *nix
| License: Freeware | Size: 45.06 KB | Download (100): Time::Skew Download |
Added: March 31, 2013 | Visits: 310
======================================main executing reference usage: usage_proclivityStateTracking.m* Each trend data point are to be of large time interval----------------------------------------------------------------------------The objective is to illustrate identification of a local maxima,...
Platforms: Matlab
| License: Shareware | Cost: $0.00 USD | Size: 215.04 KB | Download (44): Hunt For Local Maxima, Minima, Plateau Download |
Added: September 12, 2013 | Visits: 382
A Gaussian mixture model means that each data point is drawn (randomly) from one of C classes of data, with probability p_i of being drawn from class i, and each class is distributed as a Gaussian with mean standard deviation mu_i and sigma_i. Given a set of data drawn from such a distribution,...
Platforms: Matlab
| License: Shareware | Cost: $0.00 USD | Size: 20.48 KB | Download (50): gaussian_mixture_model.m Download |
Added: June 29, 2013 | Visits: 398
Just pass the dissimilarity matrix, number of clusters in the partition to be evaluated and the indexes for each data point and you will get the Dunn's index.The Dunn's index measures compactness (Maximum distance in between data points of clusters) and clusters separation (minimum distance...
Platforms: Matlab
| License: Shareware | Cost: $0.00 USD | Size: 10 KB | Download (48): Dunn's index Download |
Added: March 26, 2013 | Visits: 315
Color Scatter Plot for random data point visualization. It mimics a continuous 2D probability distribution.coldotplot(x,y,s0,Ad) creates at scatterplot with dots of sizes that correspond to their density in the swarm of points. The larger dots will also have a more "hot" color in the dense...
Platforms: Matlab
| License: Shareware | Cost: $0.00 USD | Size: 10 KB | Download (39): color dot plot Download |
Added: May 10, 2013 | Visits: 644
The package includes five versions, which are designed to work with MATLAB R14 on either Linux or Windows.InstallationRun the m-file with the main file name to start the GUI Key features "Matlab GUI for Polhemus Digitizer": - polgui_ver1_r14 : works with 1 receiver (stylus pen) -...
Platforms: Windows, *nix, Matlab,
| License: Freeware | Download (60): Matlab GUI for Polhemus Digitizer Download |
Released: July 31, 2020
|
Added: January 11, 2021 | Visits: 4.108
 Data Curve Fit Creator Add-in is an easy-to-use data analysis add-in for Microsoft Excel. It adds curve fitting, interpolation, and data smoothing functions to Excel. Curve fitting functions include polynomial fits and a versatile local regression (loess) function. Interpolations include...
Platforms: Windows, Windows 8, Windows 7, Windows Server
Data Curve Fit Creator Add-in is an easy-to-use data analysis add-in for Microsoft Excel. It adds curve fitting, interpolation, and data smoothing functions to Excel. Curve fitting functions include polynomial fits and a versatile local regression (loess) function. Interpolations include...
Platforms: Windows, Windows 8, Windows 7, Windows Server
| License: Shareware | Cost: $79.95 USD | Size: 7.12 MB | Download (465): Data Curve Fit Creator Add-in Download |
Added: March 06, 2010 | Visits: 1.175
Cascade Historian software is an event driven data storage program used to maintain persistent time-sequence data sets derived from process data. Features and Benefits In addition to providing storage the Historian also offers a historical query facility suitable for generating graphs and...
Platforms: *nix
| License: Shareware | Cost: $0.00 USD | Download (96): Cascade Historian Download |
Added: January 25, 2010 | Visits: 1.053
Data Loom is a program for exploring multivariate data. It displays the data in a parallel coordinates chart, where each data variable is represented by a vertical axis and each data point is represented by a trace drawn across all the axes. Such charts can help you to see relationships between...
Platforms: Mac
| License: Freeware | Size: 792 KB | Download (107): Data Loom Download |
Released: July 19, 2012
|
Added: July 19, 2012 | Visits: 804
LightningChart Ultimate SDK is a poweful and advanced 2D and 3D measurement, engineering and research data visualization tool for .NET. LightningChart Ultimate SDK is entirely GPU accelerated (Direct3D) and performance optimized data visualization control for presenting masses of data in 2D graph...
Platforms: Windows, Windows Vista, 7, 7x64
| License: Freeware | Download (66): LightningChart Ultimate SDK Download |
Added: June 03, 2013 | Visits: 481
The fitting of smooth curve through a set of data points and extention to this is the fitting of 'best fit' spline to a large set of data points which show the cerrent trend but which do not all lie above the curve. The method involves cluster analysis, that is, grouping the crude data into...
Platforms: Matlab
| License: Freeware | Size: 10 KB | Download (48): Natural Cubic Splines Yield Curve Download |
Added: July 30, 2013 | Visits: 404
This script takes advantage of Matlabs links with Photoshop to create a 2d transparent scatter plot of your data, which, I believe is not possible at present in Matlab. Although rasterization is not ideal, you can specify any image size in pixels (and point size) with this function. You can also...
Platforms: Matlab
| License: Shareware | Cost: $0.00 USD | Size: 10 KB | Download (46): PhotoShop Scatter Download |
Added: August 03, 2013 | Visits: 440
XY3DDensityPlotView is used to visualize the density of points described by two variables X and Y, as a surface plot. This may be useful when points are densely packed and overlapping, as in this case a scatterplot may be limited in revealing their actual distribution.The XY data must be...
Platforms: PHP
| License: Shareware | Cost: $0.00 USD | Size: 51.2 KB | Download (51): XY 3D Density Plot (for two-class data) Download |
Released: September 27, 2012
|
Added: September 27, 2012 | Visits: 623
 The Mekko Chart Creator makes it easy to create charts that show data in three dimensions.
Such a graph allows one to see both differences in market share by product type and region, and the over all size of the different markets. One can insert values, labels, or both on individual data...
Platforms: Windows
The Mekko Chart Creator makes it easy to create charts that show data in three dimensions.
Such a graph allows one to see both differences in market share by product type and region, and the over all size of the different markets. One can insert values, labels, or both on individual data...
Platforms: Windows
| License: Shareware | Cost: $49.95 USD | Download (52): Mekko Chart Creator Download |
Released: August 24, 2012
|
Added: August 24, 2012 | Visits: 461
 MedCalc is a complete statistical program for Windows designed to closely match the requirements of biomedical researchers. It is fast, user-friendly and reliable. MedCalc is the most user-friendly software for Receiver Operating Characteristic curve (ROC curves) analysis. The MedCalc ROC module...
Platforms: Windows
MedCalc is a complete statistical program for Windows designed to closely match the requirements of biomedical researchers. It is fast, user-friendly and reliable. MedCalc is the most user-friendly software for Receiver Operating Characteristic curve (ROC curves) analysis. The MedCalc ROC module...
Platforms: Windows
| License: Shareware | Cost: $395.00 USD | Size: 16.32 MB | Download (51): MedCalc 64-bit Download |
Released: October 10, 2012
|
Added: October 10, 2012 | Visits: 458
 MedCalc is a complete statistical program for Windows designed to closely match the requirements of biomedical researchers. It is fast, user-friendly and reliable.
MedCalc is the most user-friendly software for Receiver Operating Characteristic curve (ROC curves) analysis. The MedCalc ROC...
Platforms: Windows
MedCalc is a complete statistical program for Windows designed to closely match the requirements of biomedical researchers. It is fast, user-friendly and reliable.
MedCalc is the most user-friendly software for Receiver Operating Characteristic curve (ROC curves) analysis. The MedCalc ROC...
Platforms: Windows
| License: Shareware | Cost: $395.00 USD | Size: 12.95 MB | Download (535): MedCalc Download |