


Create A Pie Chart software
Create A Pie Chart
Released: February 02, 2023
|
Added: January 02, 2024 | Visits: 143
 Are you finding a product to remove your Windows login password? Please take a look at imyPass Windows Password Reset. With it, you can reset/remove your Windows password. Whats more, you are allowed to create a new admin account for your Windows PC.
Key Functions:
1. Remove your...
Platforms: Windows, Windows 8, Windows 7, Windows Server
Are you finding a product to remove your Windows login password? Please take a look at imyPass Windows Password Reset. With it, you can reset/remove your Windows password. Whats more, you are allowed to create a new admin account for your Windows PC.
Key Functions:
1. Remove your...
Platforms: Windows, Windows 8, Windows 7, Windows Server
| License: Shareware | Cost: $15.96 USD | Size: 127.96 MB | Download (27): imyPass Windows Password Reset Standard Download |
Released: April 07, 2011
|
Added: April 18, 2011 | Visits: 1.574
 XML Flash charts are easy to make using Animated Chart Pro. Create dynamic web chart with live data permanently updated from XML source. Animated Chart Pro edition generates real time web charts using dynamic data and all you have to do is to customize chart appearance, get the result and embed...
Platforms: Windows
XML Flash charts are easy to make using Animated Chart Pro. Create dynamic web chart with live data permanently updated from XML source. Animated Chart Pro edition generates real time web charts using dynamic data and all you have to do is to customize chart appearance, get the result and embed...
Platforms: Windows
| License: Shareware | Cost: $69.00 USD | Size: 2.67 MB | Download (101): Animated Chart Pro Download |
Released: August 09, 2012
|
Added: August 09, 2012 | Visits: 582
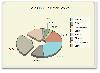
 Create pie charts based on numbers and their corresponding labels.
Platforms: Windows
Create pie charts based on numbers and their corresponding labels.
Platforms: Windows
| License: Shareware | Cost: $19.99 USD | Size: 754 KB | Download (44): Pie Chart Graph Generator Software Download |
Added: August 23, 2008 | Visits: 2.265
 The competitive matrix feature comparison chart help you to create a matrix to compare product features. This can be used internally for product planning or externally for sales purposes. Also includes "Top 10 Product Launch Mistakes" White Paper.
Platforms: Windows, Mac
The competitive matrix feature comparison chart help you to create a matrix to compare product features. This can be used internally for product planning or externally for sales purposes. Also includes "Top 10 Product Launch Mistakes" White Paper.
Platforms: Windows, Mac
| License: Shareware | Cost: $10.00 USD | Size: 1024 B | Download (550): Competitive Matrix Feature Chart Download |
Added: April 26, 2010 | Visits: 1.498
 Create PlayList is a service menu for KDE and has been tested with kde 3.5.4 and 3.5.5. The service is available over directories. It will create a M3U playlist file with .mp3, .ogg, .wav... files into the directory. Filename can be changed. To create M3U playlist file the script uses a...
Platforms: *nix
Create PlayList is a service menu for KDE and has been tested with kde 3.5.4 and 3.5.5. The service is available over directories. It will create a M3U playlist file with .mp3, .ogg, .wav... files into the directory. Filename can be changed. To create M3U playlist file the script uses a...
Platforms: *nix
| License: Freeware | Size: 2.05 KB | Download (110): Create PlayList Download |
Released: June 06, 2012
|
Added: June 06, 2012 | Visits: 515
Flash Pie Chart is a flash movie that generates dynamic Pie Charts for your ASP applications.
Platforms: Windows
| License: Demo | Cost: $49.00 USD | Size: 520 KB | Download (459): Flash Pie Download |
Released: July 26, 2012
|
Added: July 26, 2012 | Visits: 752
 This software offers a solution for users who want to create a chart of all 256 ASCII characters (including: p > n q ° ?) in MS Word. Four columns designate the decimal number, the hexadecimal number, the binary number, and the corresponding symbol. The easy to read document can be created in...
Platforms: Windows
This software offers a solution for users who want to create a chart of all 256 ASCII characters (including: p > n q ° ?) in MS Word. Four columns designate the decimal number, the hexadecimal number, the binary number, and the corresponding symbol. The easy to read document can be created in...
Platforms: Windows
| License: Shareware | Cost: $19.99 USD | Size: 1.66 MB | Download (501): MS Word ASCII Conversion Chart Creator Software Download |
Released: August 06, 2012
|
Added: August 06, 2012 | Visits: 577
Take data from a simple table and assign the columns to a 3D chart. Then explore and analyse it directly in the chart, touching the bars and pie segments to reveal their content. Adjust the scale of each chart dimension, to group data within the bars and further simplify the chart. Drag filters...
Platforms: Mac
| License: Shareware | Cost: $39.00 USD | Size: 11.8 MB | Download (52): friedEgg Touch Download |
Added: February 18, 2006 | Visits: 3.067
 Add Powerful reporting features to your Web / Intranet pages and applications.
With the advanced graphing package you will be quickly adding impressive dynamic charting capabilities bringing your data alive !
Powerful components provide both client & server side solutions for adding graphs &...
Platforms: Windows, Mac, *nix, Windows CE
Add Powerful reporting features to your Web / Intranet pages and applications.
With the advanced graphing package you will be quickly adding impressive dynamic charting capabilities bringing your data alive !
Powerful components provide both client & server side solutions for adding graphs &...
Platforms: Windows, Mac, *nix, Windows CE
| License: Shareware | Cost: $199.95 USD | Size: 214 KB | Download (527): Advanced Graph and Chart Collection Download |
Released: September 15, 2008
|
Added: November 29, 2008 | Visits: 1.633
 Easy to use .NET charting controls for ASP.NET and Windows Forms applications.
The package includes Graph, Line, Area, Bar and Pie Chart components. Each of them can be fully customized via the hundreds properties and methods exposed. All controls support data-binding for fast and easy database...
Platforms: Windows
Easy to use .NET charting controls for ASP.NET and Windows Forms applications.
The package includes Graph, Line, Area, Bar and Pie Chart components. Each of them can be fully customized via the hundreds properties and methods exposed. All controls support data-binding for fast and easy database...
Platforms: Windows
| License: Demo | Cost: $300.00 USD | Size: 7.02 MB | Download (109): MasterChart Download |
Released: January 17, 2010
|
Added: January 25, 2010 | Visits: 1.680
 Project planning application for Windows NT/2000/XP/Vista/Win7. A separate version is also available for a range of PDAs.
Create a project plan by entering tasks and resources, add holiday information and create dependencies between tasks. Plan will calculate the entire project schedule...
Platforms: Windows
Project planning application for Windows NT/2000/XP/Vista/Win7. A separate version is also available for a range of PDAs.
Create a project plan by entering tasks and resources, add holiday information and create dependencies between tasks. Plan will calculate the entire project schedule...
Platforms: Windows
| License: Shareware | Cost: $39.95 USD | Size: 1.12 MB | Download (139): Plan for Windows Download |
Released: January 22, 2016
|
Added: March 05, 2016 | Visits: 1.453
 Easy to use .NET gauge and charting controls for WPF applications.
The package includes Graph, Line, Area, Surface, Bar, Radar and Pie chart components (in 2D and 3D) and Oval and Linear gauges. Each of them can be fully customized via the hundreds properties and methods exposed. All controls...
Platforms: Windows, Windows 7, Windows Server
Easy to use .NET gauge and charting controls for WPF applications.
The package includes Graph, Line, Area, Surface, Bar, Radar and Pie chart components (in 2D and 3D) and Oval and Linear gauges. Each of them can be fully customized via the hundreds properties and methods exposed. All controls...
Platforms: Windows, Windows 7, Windows Server
| License: Commercial | Cost: $300.00 USD | Size: 9.73 MB | Download (80): MindFusion.Charting for WPF Download |
Released: June 24, 2012
|
Added: June 24, 2012 | Visits: 1.374
MB Free Vedic Astrology Rashi Chart (South Indian Style) Software is a rashi chart software based on Vedic Astrology. This program tells us in detail the accurate astronomical locations of planets at the time of an individual's birth. Using the information that your birth chart gives, Vedic...
Platforms: Windows
| License: Freeware | Size: 1.32 MB | Download (498): MB Astrology Rashi Chart (South Indian Style) Download |
Released: July 02, 2012
|
Added: July 02, 2012 | Visits: 1.126
MB Free Vedic Astrology Rashi Chart (North Indian Style) Software is a rashi chart software based on Vedic Astrology. This program tells us in detail the accurate astronomical locations of planets at the time ofan individual's birth. Using the information that your birth chart gives, Vedic...
Platforms: Windows
| License: Freeware | Size: 1.38 MB | Download (487): MB Astrology Rashi Chart (North Indian Style) Download |
Released: October 12, 2016
|
Added: May 15, 2017 | Visits: 1.073
 Blue Excel is a powerful Excel Addin. It is designed to make program Gantt Chart. Excel is often used to make program plan instead of Microsoft Project due to it is familiar by most people.
Blue Excel provides faster way to create program Gantt Chart plan. It supports plan based on week,...
Platforms: Windows, Windows 7
Blue Excel is a powerful Excel Addin. It is designed to make program Gantt Chart. Excel is often used to make program plan instead of Microsoft Project due to it is familiar by most people.
Blue Excel provides faster way to create program Gantt Chart plan. It supports plan based on week,...
Platforms: Windows, Windows 7
| License: Shareware | Cost: $29.90 USD | Size: 3.24 MB | Download (127): Blue Excel Download |
Released: August 17, 2012
|
Added: August 17, 2012 | Visits: 481
 Create a text file which contains the entire layout of folders on specified hard drives.
Platforms: Windows
Create a text file which contains the entire layout of folders on specified hard drives.
Platforms: Windows
| License: Shareware | Cost: $19.99 USD | Size: 754 KB | Download (411): Create List of Folders & Subfolders On Hard Drive Software Download |
Added: May 10, 2013 | Visits: 427
phPie() is a PHP4 script that creates a PNG- (or GIF- or JPG-) format pie chart, with optional legend.
Platforms: Windows, Mac, *nix, PHP, BSD Solaris
| License: Freeware | Download (60): phPie() Download |
Added: June 02, 2013 | Visits: 640
Show how to plot a Smith chart in Matlab. Show how to perform a 2 element match to 50 ohms termination using the Smith chart. Show that depending on the termination impedance that there is more than one combination of elements solving the problem.
Platforms: Matlab
| License: Freeware | Size: 1.74 MB | Download (55): Smith chart demo Download |
Added: June 30, 2013 | Visits: 529
OBSERVE Create a video file, by continuously reading an image from a local image file, an image file on the internet, a video device connected to your computer or your computer screen.
Platforms: Matlab
| License: Shareware | Cost: $0.00 USD | Size: 10 KB | Download (51): Create Video file from image or device Download |
Added: July 25, 2013 | Visits: 543
Create images with diffraction-limited spots of varying size and intensity, with noise.Tristan UrsellMarch 2012Create an image with randomly positioned, diffraction-limited spots with full data on actual spot positions and parameters. Useful for testing a spot finding...
Platforms: Matlab
| License: Shareware | Cost: $0.00 USD | Size: 10 KB | Download (45): Create a Simulated Image of Diffraction Limited Spots with Noise Download |