


Climate Graphs software
Climate Graphs
Added: May 18, 2013 | Visits: 623
 HTML-Graphs could be used to create horizontal / vertical bar graphs, progress bars and faders.You can create simple graphs and even grouped bar graphs with legends, add labels, change colors etc. No graphics ped bar gcal libraries are required.
Platforms: JavaScript
| License: Freeware | Size: 10 KB | Download (46): HTML-Graphs javascript Download |
Released: August 14, 2012
|
Added: August 14, 2012 | Visits: 817
CDAT (Climate Data Analysis Tools) is an open-source, Python-based environment for scientific calculations and graphics with focus on the needs of climate modelers. It is coordinated by the Program for Climate Model Diagnosis and Intercomparison, LLNL
Platforms: Mac, BSD, Linux
| License: Freeware | Size: 247.78 MB | Download (46): Climate Data Analysis Tools Download |
Released: June 27, 2012
|
Added: June 27, 2012 | Visits: 414
The Visualization of Protein-Ligand Graphs (VPLG) software package computes and visualizes protein graphs. It works on the super-secondary structure level and uses the atom coordinates from PDB files and the SSE assignments of the DSSP algorithm.
Platforms: Windows, Mac, BSD, Linux
| License: Freeware | Size: 6.6 MB | Download (46): Visualization of Protein-Ligand Graphs Download |
Released: December 03, 2023
|
Added: February 24, 2024 | Visits: 183
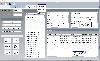 The Estimate Missing Climate Data Tool (EMCD) stands as a comprehensive solution designed to address and fill gaps in climate data, ensuring a robust and accurate dataset for comprehensive analysis. EMCD incorporates advanced techniques to overcome missing values, utilizing neighboring stations...
Platforms: Windows, Windows 8, Windows 7, Windows Server
| License: Shareware | Cost: $99.00 USD | Size: 11.62 MB | Download (46): Estimate Missing Climate Data Download |
Released: November 03, 2012
|
Added: November 03, 2012 | Visits: 432
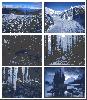 See the climate change from one season to another with this free screensaver. The high quality of this photography will capture your imagination. 14 full size images with customisable transition effects. Top screensaver for nature or scenery lovers.
Platforms: Windows
| License: Freeware | Size: 6.5 MB | Download (46): Seasonal Changes Screensaver Download |
Added: July 01, 2013 | Visits: 361
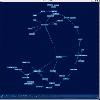
This function graphs the neuron's weight and the input vectors. You can label the neurons and inputs, change the marker size, and color code the map to see which inputs activate which neurons (a visual representation of the approximation of the input field of a neuron in the adaptive network).
Platforms: Matlab
| License: Freeware | Size: 10 KB | Download (46): LABELNET Download |
Added: June 07, 2013 | Visits: 685
Use this script to create horizontal / vertical bar graphs, progress bars and faders.You can create simple graphs and even grouped bar graphs with legends, add labels, change colors etc. No graphics or graphical libraries required.This script was tested with PHP 4 5.
Platforms: PHP
| License: Freeware | Size: 10 KB | Download (45): HTML-Graphs (PHP) Download |
Released: November 07, 2012
|
Added: November 07, 2012 | Visits: 351
 gxlbrowse is a simple utility that reads graphs in the GraphViz XML format (GXL) and presents them in an interactive browser.
Platforms: Windows, Mac, Linux
| License: Freeware | Size: 218 KB | Download (45): gxlbrowse - interactive graphviz graphs Download |
Added: March 26, 2013 | Visits: 482
The SumProductLab provides a set of basic factor nodes for building up a factor graph. One can try out ideas by instantiating the necessary constraint nodes, connecting them up, and giving some evidence. The sum-product (or belief propagation) algorithm will compute the message to each node in...
Platforms: Matlab
| License: Shareware | Cost: $0.00 USD | Size: 829.44 KB | Download (45): SumProductLab for Factor Graphs Download |
Added: September 03, 2013 | Visits: 627
The 3D Stacked Horizontal Bar Graph software provides both a client and server side solution for the incorporation of bar graphs and charts into web pages.It provides versatile components so that web authors and Java developers can easily build and publish dynamic and interactive bar charts.Both...
Platforms: PHP
| License: Shareware | Cost: $49.00 USD | Size: 389.12 KB | Download (45): 2D 3D Stacked Horizontal Bar Graph Script Download |
Added: August 31, 2013 | Visits: 554
Cacti is a complete frontend to RRDTool, it stores all of the necessary information to create graphs and populate them with data in a MySQL database.The frontend is completely PHP driven. Along with being able to maintain Graphs, Data Sources, and Round Robin Archives in a database, cacti handles...
Platforms: PHP
| License: Freeware | Size: 1.07 MB | Download (45): Cacti - RRDTool Interface Script Download |
Added: May 26, 2013 | Visits: 453
DynaGraph creates dynamic graphs based on data selected from a database query. Using PHP, DynaGraph accesses a MySQL database, and uses the results to plot information to a bar graph in the GIF format, using gd library.
Platforms: PHP
| License: Freeware | Size: 10 KB | Download (45): DynaGraph for Scripts Download |
Added: August 24, 2013 | Visits: 922
Please refer the previous versionsSignal Processor for Graphs (Pictures) update 1http://www.mathworks.com/matlabcentral/fil...objectType=FILESignal Processor for Graphs (Pictures)http://www.mathworks.com/matlabcentral/fil...objectType=FILE
Platforms: Matlab
| License: Freeware | Size: 153.6 KB | Download (44): Signal Processor for Graphs (Pictures) update 2 - Final Download |
Added: August 26, 2013 | Visits: 611
Use this script to create horizontal / vertical bar graphs, progress bars and faders.You can create simple graphs and even grouped bar graphs with legends, add labels, change colors etc. No graphics or graphical libraries required.This script was tested with PHP 4 5.
Platforms: PHP
| License: Freeware | Size: 10 KB | Download (44): HTML-Graphs (PHP) for Scripts Download |
Added: April 25, 2013 | Visits: 435
A very easy symbolic method for reduction of block diagrams or signal flow graphs with Matlab is presented. The method can be applied to every kind of diagram and it is possible to obtain in one stage all transfer functions for a given input. The method is validated with some examples, including...
Platforms: Matlab
| License: Shareware | Cost: $0.00 USD | Size: 122.88 KB | Download (44): Symbolic reduction of block diagrams and signal flow graphs Download |
Added: April 19, 2013 | Visits: 969
The 2D / 3D Area Graph provides both a client and server side solution for the incorporation of area graphs and charts into web pages. It provides versatile components so that web authors and Java developers can easily build and publish dynamic and interactive area charts.Both the applet and...
Platforms: Java
| License: Shareware | Cost: $49.00 USD | Size: 358.4 KB | Download (44): 2D / 3D Area Graph and Charts Download |
Added: April 04, 2013 | Visits: 454
Matlab program reads an XLS file of data and displays statistical graphs and charts on the acquisition of Romanian citizenship in Bucharest in December 2010 and 2011 iauarie ...
Platforms: Matlab
| License: Freeware | Size: 307.2 KB | Download (44): Agentia Nationala pentru Cetatenie Bucuresti Download |
Added: August 28, 2013 | Visits: 480
PHPCallGraph generates static call graphs for PHP source code using the CodeAnalyzer of the InstantSVC project and the DOT tool.The graphs can be leveraged to gain a better understanding of large software systems or even to debunk design flaws in them.
Platforms: PHP
| License: Freeware | Size: 1.06 MB | Download (44): PHPCallGraph for Scripts Download |
Added: May 09, 2013 | Visits: 575
This video describes working with graphs in MATLAB in the Czech language. It's the ninth part of complete video tutorial about MATLAB and SIMULINK.AVI file is compressed by WinZIP and WinRAR, TechSmith Screen Capture Codec (TSCC) is necessary to view the file.
Platforms: PHP
| License: Shareware | Cost: $0.00 USD | Size: 19.91 MB | Download (43): MATLAB video tutorial in Czech - Lesson 9: Graphs Download |
Added: July 17, 2013 | Visits: 555
Charts and Graphs is a API for developers. It can easily be extended by third-party modules that want to add their own charting implementations. It does nothing by itself. It should only be installed if some other module requires it.See Views Charts for usage of a user-centric application as the...
Platforms: PHP
| License: Freeware | Size: 337.92 KB | Download (43): Charts and Graphs Download |