


Stage Plot freeware
Stage Plot
Added: July 11, 2013 | Visits: 446
 The script plots the envelope of the bode plot for a parametric uncertain/interval system.interval_bode(NumVec,DenVec,clr)The function accepts the numerator (NumVec) and denominator (DenVec) of the uncertain system as matrices of two rows each. The first row containing the lower bounds and the...
Platforms: Matlab
| License: Freeware | Size: 10 KB | Download (43): Interval Bode Plot Download |
Added: March 27, 2013 | Visits: 464
This function makes an imagesc-like plot for two matrices with equal dimensions, in which each each cell of the plot is split diagonally with the upper triangle of cell (i,j) in the plot representing the Matrix1(i,j) and the lower triangle representing Matrix2(i,j).
Platforms: Matlab
| License: Freeware | Size: 10 KB | Download (43): Overlay 2 matrices in an imagesc-like plot Download |
Added: June 21, 2013 | Visits: 497
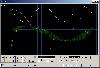
You have to give it the coordinates of the ends, number of coils, natural length and radius and it gives to you the (xs,ys) coordinates of the spring points, ready to use it with plot(). The picture shows an instant image of an animation of two coupled-pendulums oscillating Type for usage. Don't...
Platforms: Matlab
| License: Freeware | Size: 10 KB | Download (43): Spring() To plot and animate a 2D-Spring Download |
Added: May 16, 2013 | Visits: 445
This function plot in the same figure the center trajectory and attitude of an aircraft. See the figure to understand better.The version 3.0, extend the functionality of version 2.In this last version :- fixed the Reference System Bugs- possibility to export the trajectory animation in avi format...
Platforms: Matlab
| License: Freeware | Size: 10 KB | Download (42): Trajectory and Attitude Plot Version 3 Download |
Added: March 28, 2013 | Visits: 442
Plot earth in 3D sphereSeveral maps and resolutions are availableMore comprehensive map collection is available athttp://www.mediafire.com/?m2mn1mgdngt
Platforms: Matlab
| License: Freeware | Size: 17.82 MB | Download (39): Plot earth Download |
Added: March 25, 2013 | Visits: 406
- Plot arithmetic and geometric Brownian motions- Plot Brownian bridges, 2D and 3D Brownian motions- Plot some random paths for the the interest spot rate: The two models you can chose from are the Vasicek and the Cox- Ingersoll-Ross (CIR) models
Platforms: Matlab
| License: Freeware | Size: 10 KB | Download (43): Plot Some Paths Download |
Added: June 04, 2013 | Visits: 613
I would like to plot figure(10000) using double axis, see line number 217and I would like to make a movie file of the figure formed using the loop which is from line number 161 to line number 189
Platforms: Matlab
| License: Freeware | Size: 20.48 KB | Download (40): would like to plot using double axis Download |
Added: August 12, 2013 | Visits: 255
Core Plot is a plotting framework for Mac OS X and iOS. It provides 2D visualization of data, and is tightly integrated with Apple technologies like Core Animation, Core Data, and Cocoa Bindings.
Platforms: Mac
| License: Freeware | Size: 9.57 MB | Download (40): Core Plot Download |
Added: October 24, 2013 | Visits: 530
The Complex Function Plot program displays a user-defined complex function of position and time using representations that map phase into color. The default complex function is a time-dependent complex Gaussian and the representation can be changed by selecting a radio button. Additional...
Platforms: Mac
| License: Freeware | Size: 61.44 KB | Download (37): Complex Function Plot Download |
Added: June 29, 2013 | Visits: 368
The Ramachandran Plot Explorer really offers something new. The Ramachandran Plot Explorer is designed to make it easy to examine the conformation of a polypeptide - through the interactive Ramachandran plot (?Ya* -?Y? angles) and ?Ya*?-angle tool. Simply click on a residue, then drag the marker...
Platforms: Mac
| License: Freeware | Size: 2.51 MB | Download (41): Ramachandran Plot Explorer Download |
Released: November 11, 2007
|
Added: March 24, 2008 | Visits: 4.917
 Area converter and price calculator software is available free of cost. Tool installation wizard makes easy to install the software on your computer on various version of windows operating system like 98, ME, NT, 2000, 2003 server, XP, VISTA. Software can figure out cost of shop, office, homes,...
Platforms: Windows
| License: Freeware | Size: 759 KB | Download (298): Area Conversion and Price Calculator Download |
Added: February 08, 2010 | Visits: 1.261
Chemistry::Artificial::Graphics is a graphic plot for artificial with database support. SYNOPSIS use strict; use Chemistry::SQL; use Chemistry::Artificial::Graphics; my $dbname = $ARGV[0]; my $chaname = $ARGV[1]; my $file = $ARGV[2]; my $mode = $ARGV[3]; if (scalar(@ARGV)!=4) {...
Platforms: *nix
| License: Freeware | Size: 14.34 KB | Download (112): Chemistry::Artificial::Graphics Download |
Added: July 27, 2010 | Visits: 1.553
IP-Atlas tries to plot your location or any other host on the internet using the NetGeo data. It finds the latitude and longitude coordinates of the host and plots it on an image for you.It finds the latitude and longitude coordinates of the host and plots it on an image for you. You can try the...
Platforms: *nix
| License: Freeware | Size: 93.18 KB | Download (128): IP-Atlas Download |
Added: January 09, 2010 | Visits: 772
Xastir ptoject can receive and plot APRS position packets. Development is a collaborative effort of programmers from around the world. Xastir supports many map formats and is highly customizable. Check out the "Screen Shots" link to see just a few of the ways that Xastir can be used. Xastir...
Platforms: *nix
| License: Freeware | Size: 2.1 MB | Download (95): Xastir Download |
Added: January 25, 2010 | Visits: 824
Plot is a scientific 2D plotting program for Mac OS X. Plot is designed for everyday plotting, it is easy to use, it creates high quality plots, it allows easy and powerful manipulations and calculations of data, and it is free.Available Features: ASCII, Binary, MySQL, SciPlot and Perl based...
Platforms: Mac
| License: Freeware | Download (115): Plot Download |
Released: September 10, 2012
|
Added: September 10, 2012 | Visits: 683
QtGrace is a small, easy to use application specially designed to offer users a program to display or plot data, analyze data and prepare it for printing.
This software is special because it combines the convenience of a graphical user interface with the power of a scripting language which...
Platforms: Windows, Windows Vista, 7
| License: Freeware | Download (454): QtGrace Download |
Released: August 19, 2012
|
Added: August 19, 2012 | Visits: 396
The Plot.py project tries to supply an easy to use measurement data visualization and treatment framework being easy to use while keeping the freedom for advanced users to execute additional data treatment algorithms. The program is build on a object oriented modular basis to provide the...
Platforms: Linux
| License: Freeware | Download (441): Plotting GUI for Linux Download |
Released: June 07, 2012
|
Added: June 07, 2012 | Visits: 467
PlotDWGarr is an Autocad plugin designed to enable you to plot a rectangular array of drawings from the DWG modelspace or to generate a set of layouts.
If you get a DWG drawing which contains multiple frames (with individual drawings) composed as an array in the modelspace, you can use the...
Platforms: Windows
| License: Freeware | Download (425): PlotDWGarr Download |
Released: November 26, 2012
|
Added: November 26, 2012 | Visits: 376
The Plot.py project tries to supply an easy to use measurement data visualization and treatment framework being easy to use while keeping the freedom for advanced users to execute additional data treatment algorithms. The program is build on a object oriented modular basis to provide the...
Platforms: Windows
| License: Freeware | Size: 41.9 MB | Download (503): Plotting GUI Download |
Released: July 07, 2012
|
Added: July 07, 2012 | Visits: 914
 Universal oscilloscope GUI ( Real-time plot ) DLL library for data acquisition, simulation, debugging.Advantages:1.Speedy performance: the library makes it possible to bring out into the beams of the viewing oscilloscope over a million quantization steps of signal per second (on the Pentium III...
Platforms: Windows, Windows Vista
| License: Freeware | Size: 3.54 MB | Download (121): Universal Software Oscilloscope Library Download |