


Radial Chart Graphic freeware
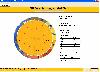
Radial Chart Graphic
Added: November 30, 2013 | Visits: 474
 This module allows you to plot and output Radial or Radar charts using the GD library. The module is based on GD::Graph in how it can be used where possible. A radial chart has multiple axis spread out from the centre, like spokes on a wheel. Each axis represents a particular measurement. Values...
Platforms: *nix
| License: Freeware | Size: 10.24 KB | Download (38): GD::Chart::Radial Download |
Added: July 08, 2006 | Visits: 2.455
 Graphics4VO is developed for use with CA-Visual Objects (Version 2.0 upto 2.7). It is based on 32-Bit-WINDOWS- API. The library allows development of graphics oriented CA-Visual Objects applications for 32-Bit Windows operating systems. The Graphics Library Graphics4VO includes classes, methods...
Platforms: Windows
| License: Freeware | Size: 3.65 MB | Download (115): Graphics4VO Examples Program Download |
Released: November 01, 2012
|
Added: November 01, 2012 | Visits: 602
 GLE (Graphics Layout Engine) is a graphics scripting language designed for creating publication quality graphs, plots, diagrams, figures and slides. GLE supports various graph types (function plots, histograms, bar graphs, scatter plots, contour lines, color maps, surface plots, ...) through a...
Platforms: Windows
| License: Freeware | Size: 9.85 MB | Download (52): GLE for Windows Download |
Released: October 14, 2012
|
Added: October 14, 2012 | Visits: 546
 GLE (Graphics Layout Engine) is a graphics scripting language designed for creating publication quality graphs, plots, diagrams, figures and slides. GLE supports various graph types (function plots, histograms, bar graphs, scatter plots, contour lines, color maps, surface plots, ...) through a...
Platforms: Linux
| License: Freeware | Size: 2.27 MB | Download (52): GLE for Linux Download |
Released: October 27, 2012
|
Added: October 27, 2012 | Visits: 575
 GLE (Graphics Layout Engine) is a graphics scripting language designed for creating publication quality graphs, plots, diagrams, figures and slides. GLE supports various graph types (function plots, histograms, bar graphs, scatter plots, contour lines, color maps, surface plots, ...) through a...
Platforms: Mac
| License: Freeware | Size: 6.07 MB | Download (47): GLE for Mac OS X Download |
Released: February 16, 2008
|
Added: February 22, 2008 | Visits: 10.241
 MB Free Astrology Natal Chart Software is a free astrology natal chart generator software based on the principles of western astrology or tropical astrology. This program tells us in detail the accurate astronomical locations of planets at the time of an individual's birth. Using the information...
Platforms: Windows
| License: Freeware | Size: 1.68 MB | Download (1721): MB Free Astrology Natal Chart Download |
Added: January 18, 2010 | Visits: 2.270
Chart::Graph::Gnuplot is a function in module Chart::Graph that lets you generate graphs on the fly in perl. SYNOPSIS use Chart::Graph::Gnuplot qw(&gnuplot); gnuplot(%global_options, [%data_set_options, @matrix], [%data_set_options, @x_column, @y_column], [%data_set_options, < filename...
Platforms: *nix
| License: Freeware | Size: 8.19 KB | Download (173): Chart::Graph::Gnuplot Download |
Added: January 18, 2010 | Visits: 1.665
Chart::Graph::Xrt3d is a Perl module for creating 3D graph charts. SYNOPSIS #Include module use Chart::Graph::Xrt3d qw(xrt3d); # Function call xrt3d(%options, @data_set ); This module is unmaintained, it worked with Sitrakas XRT, and hasnt been tested against newer versions. Sitraka...
Platforms: *nix
| License: Freeware | Size: 245.76 KB | Download (169): Chart::Graph::Xrt3d Download |
Added: January 18, 2010 | Visits: 1.432
Chart::Graph::Xrt2d is a Perl module for creating graph charts. SYNOPSIS #Include module use Chart::Graph::Xrt2d qw(xrt2d); # Function call xrt2d(%options, [%data_options1, @data_set1], [%data_options2, @data_set2], . . ); This module is unmaintained, it worked with Sitrakas XRT,...
Platforms: *nix
| License: Freeware | Size: 245.76 KB | Download (124): Chart::Graph::Xrt2d Download |
Added: August 10, 2010 | Visits: 1.521
Chart::Graph is a Perl extension for a front-end to gnuplot, XRT, and Xmgrace. SYNOPSIS # EXAMPLE: gnuplot #make sure to include Chart::Graph use Chart::Graph:Gnuplot qw(gnuplot); gnuplot(%global_options, [%data_set_options, @matrix], [%data_set_options, @x_column, @y_column],...
Platforms: *nix
| License: Freeware | Size: 245.76 KB | Download (111): Chart::Graph Download |
Added: January 09, 2010 | Visits: 2.551
Chart::Plot::Canvas is a Perl module to plot two dimensional data in an Tk Canvas. SYNOPSIS use Chart::Plot::Canvas; my $img = Chart::Plot::Canvas->new(); my $anotherImg = Chart::Plot::Canvas->new ($image_width, $image_height); $img->setData (@dataset) or die( $img->error() );...
Platforms: *nix
| License: Freeware | Size: 5.12 KB | Download (162): Chart::Plot::Canvas Download |
Added: November 19, 2010 | Visits: 1.180
Chart::EPS_graph creates line graphs in PostScript as *.eps format. SYNOPSIS # Create anew a 600 x 600 points (not pixels!) EPS file my $eps = Chart::EPS_graph->new(600, 600); # Choose minimum required display info $eps->set( label_top => Graph Main Title, label_y1 => Y1 Axis Measure...
Platforms: *nix
| License: Freeware | Size: 24.58 KB | Download (121): Chart::EPS_graph Download |
Added: July 05, 2010 | Visits: 1.812
Chart Taglibs is a free taglib (JSP 1.1) library for JFreeChart. These are easy to use, and allow the developer to draw any graphics supported by JFreeChart using only the tags. Chart Taglibs currently supports pie charts (2D & 3D), bar charts (2D & 3D), and line charts. Whats New in This...
Platforms: *nix
| License: Freeware | Size: 18.43 KB | Download (114): Chart Taglibs Download |
Added: January 13, 2010 | Visits: 1.375
Chart::Scientific is a Perl module that can generate simple 2-D scientific plots with logging, errbars, etc. SYNOPSIS Procedural interface use Chart::Scientific qw/make_plot/; make_plot ( x_data => @x_values, y_data => @yvalues ); The subroutine make_plot creates a Chart::Scientific...
Platforms: *nix
| License: Freeware | Size: 16.38 KB | Download (109): Chart::Scientific Download |
Added: March 04, 2010 | Visits: 1.372
g3d Graphic Tools project consists of a XML file format and generic development tools for games. The problem is that often as a games developer you need to work with many 3d editing tools and rendering engines, and there should be an easy and portable way to move objects, levels, etc. around....
Platforms: *nix
| License: Freeware | Size: 2.3 MB | Download (108): g3d Graphic Tools Download |
Added: November 09, 2010 | Visits: 1.195
Chart::PNGgraph is a graph plotting module (deprecated). SYNOPSIS use Chart::PNGgraph::moduleName; Chart::PNGgraph is a perl5 module to create PNG output for a graph. Chart::PNGgraph is nothing more than a wrapper around GD::Graph, and its use is deprecated. It only exists for backward...
Platforms: *nix
| License: Freeware | Size: 33.79 KB | Download (110): Chart::PNGgraph Download |
Added: January 08, 2010 | Visits: 1.278
SDL::Tool::Graphic is a module for zooming and rotating SDL::Surface objects. METHODS zoom ( surface, xzoom, yzoom, smooth ) SDL::Tool::Graphic::zoom scales a SDL::Surface along the two axis independently. rotoZoom ( surface, angle, zoom, smooth ) SDL::Tool::Graphic::rotoZoom rotates...
Platforms: *nix
| License: Freeware | Size: 778.24 KB | Download (123): SDL::Tool::Graphic Download |
Added: July 09, 2010 | Visits: 1.356
Chart::Sequence is a sequence Perl class. SYNOPSIS use Chart::Sequence; my $s = Chart::Sequence->new( Nodes => [qw( A B C )], Messages => [ [ A => B => "Message 1" ], [ B => A => "Ack 1" ], [ B => C => "Message 2" ], ], ); # or # my $s = Chart::Sequence->new( SeqMLInput =>...
Platforms: *nix
| License: Freeware | Size: 15.36 KB | Download (105): Chart::Sequence Download |
Added: January 22, 2010 | Visits: 1.653
Chart::Plot is a Perl module to plot two dimensional data in an image. SYNOPSIS use Chart::Plot; my $img = Chart::Plot->new(); my $anotherImg = Chart::Plot->new ($image_width, $image_height); $img->setData (@dataset) or die( $img->error() ); $img->setData (@xdataset, @ydataset);...
Platforms: *nix
| License: Freeware | Size: 15.36 KB | Download (116): Chart::Plot Download |
Added: November 03, 2010 | Visits: 1.202
Chart::XMGR is a Perl object for displaying data via XMGR. SYNOPSIS use Chart::XMGR; xmgr($a, { SYMBOL => plus}; use Chart::XMGR (); $xmgr = new Chart::XMGR; $xmgr->line($pdl); $pdl->$xmgr->line; xmgr($pdl, { LINESTYLE => dotted }); Provides a perl/PDL interface to the XMGR...
Platforms: *nix
| License: Freeware | Size: 8.19 KB | Download (106): Chart::XMGR Download |