


Plotting Graphs freeware
Plotting Graphs
Released: November 18, 2012
|
Added: November 18, 2012 | Visits: 355
 A Perl object-oriented library for plotting graphs with Gnuplot.
Platforms: Windows, Mac, Linux
| License: Freeware | Size: 38.61 KB | Download (44): Chart Gnuplot Download |
Added: May 10, 2013 | Visits: 765
 It is implemented in JavaScript, using the jQuery and Prototype framewroks, and uses image formats like SVG and VML. Key features "JSXGraph": - Euclidean Geometry: Points, lines, circles, intersections, perpendicular lines, angles - Curve plotting: Graphs, parametric curves, polar curves, data...
Platforms: Windows, Mac, *nix, JavaScript, BSD Solaris
| License: Freeware | Download (58): JSXGraph Download |
Added: October 13, 2010 | Visits: 989
RLPlot project is is a plotting program to create high quality graphs from data. Based on values stored in a spreadsheet several menus help you to create graphs of your choice. The Graphs are displayed as you get them (WYSIWIG). Double click any element of the graph (or a single click with the...
Platforms: *nix
| License: Freeware | Size: 993.28 KB | Download (106): RLPlot Download |
Released: June 20, 2012
|
Added: August 30, 2012 | Visits: 1.809
 Graphs Made Easy (GME) is a free, easy to use program to make line, bar, pie, area, series bar and stack bar graphs.
It has a simplified, self-explanatory user-interface, and allows numbers or date values on the X-axis. It is designed to allow the easiest possible graph creation experience....
Graphs Made Easy (GME) is a free, easy to use program to make line, bar, pie, area, series bar and stack bar graphs.
It has a simplified, self-explanatory user-interface, and allows numbers or date values on the X-axis. It is designed to allow the easiest possible graph creation experience....
Platforms: Windows
| License: Freeware | Size: 2.29 MB | Download (165): Graphs Made Easy Download |
Released: June 26, 2012
|
Added: June 26, 2012 | Visits: 999
 With 1-2-3 PieCharts you can now quickly and easily create professional looking 3d graphs without any of the usual hassle. This 3d graph software from Java is the perfect way to show statistics and information in an eye-catching and easy to understand way.If you download this 3d graph software...
Platforms: Windows
| License: Freeware | Size: 2.93 MB | Download (506): Make Professional looking graphs with Java 3d Graph Software Download |
Added: May 10, 2013 | Visits: 821
Converting DOT graphs to SVG script converts graphs in the DOT format to SVG on Windows. This script provides you a quick way of converting from the DOT format of representing a graph (which is very handy) to SVG (which looks very nice) on Windows. Using the win32all extensions, you can do this...
Platforms: Windows, Mac, *nix, Python, BSD Solaris
| License: Freeware | Download (57): Converting DOT graphs to SVG Download |
Added: May 18, 2013 | Visits: 623
HTML-Graphs could be used to create horizontal / vertical bar graphs, progress bars and faders.You can create simple graphs and even grouped bar graphs with legends, add labels, change colors etc. No graphics ped bar gcal libraries are required.
Platforms: JavaScript
| License: Freeware | Size: 10 KB | Download (46): HTML-Graphs javascript Download |
Added: August 24, 2013 | Visits: 922
Please refer the previous versionsSignal Processor for Graphs (Pictures) update 1http://www.mathworks.com/matlabcentral/fil...objectType=FILESignal Processor for Graphs (Pictures)http://www.mathworks.com/matlabcentral/fil...objectType=FILE
Platforms: Matlab
| License: Freeware | Size: 153.6 KB | Download (44): Signal Processor for Graphs (Pictures) update 2 - Final Download |
Added: June 07, 2013 | Visits: 685
Use this script to create horizontal / vertical bar graphs, progress bars and faders.You can create simple graphs and even grouped bar graphs with legends, add labels, change colors etc. No graphics or graphical libraries required.This script was tested with PHP 4 5.
Platforms: PHP
| License: Freeware | Size: 10 KB | Download (45): HTML-Graphs (PHP) Download |
Added: August 26, 2013 | Visits: 612
Use this script to create horizontal / vertical bar graphs, progress bars and faders.You can create simple graphs and even grouped bar graphs with legends, add labels, change colors etc. No graphics or graphical libraries required.This script was tested with PHP 4 5.
Platforms: PHP
| License: Freeware | Size: 10 KB | Download (44): HTML-Graphs (PHP) for Scripts Download |
Added: July 17, 2013 | Visits: 555
Charts and Graphs is a API for developers. It can easily be extended by third-party modules that want to add their own charting implementations. It does nothing by itself. It should only be installed if some other module requires it.See Views Charts for usage of a user-centric application as the...
Platforms: PHP
| License: Freeware | Size: 337.92 KB | Download (49): Charts and Graphs Download |
Added: June 24, 2013 | Visits: 387
RLPlot is is a plotting program to create high quality graphs from data. Based on values stored in a spreadsheet several menus help you to create graphs of your choice. The Graphs are displayed as you get them (wysiwyg). Double click any element of the graph (or a single click with the right...
Platforms: *nix
| License: Freeware | Size: 593.92 KB | Download (36): RLPlot for Linux Download |
Added: August 05, 2008 | Visits: 2.113
Trigonometric Graphs renders a number of moving fragments of sine and cosine graphs, meant to be visually attractive. The application is designed for use on a modern LCD.
Platforms: Windows
| License: Freeware | Size: 517 KB | Download (606): Trigonometric Graphs Download |
Added: October 14, 2010 | Visits: 1.655
GD::Graph is a graph plotting module for Perl 5. SYNOPSIS use GD::Graph::moduleName; GD::Graph is a perl5 module to create charts using the GD module. The following classes for graphs with axes are defined: GD::Graph::lines Create a line chart. GD::Graph::bars and GD::Graph::hbars...
Platforms: *nix
| License: Freeware | Size: 143.36 KB | Download (111): GD::Graph Download |
Added: January 18, 2010 | Visits: 763
MoioChart project is my Java library to draw function plots, bar graphs, pie graphs, etc. Why should I use it? Firstly, because it is very easy to use. For example: Drawable objects such as functions, axes, pies, etc. can be added to or removed from the Chart via the standard Collection...
Platforms: *nix
| License: Freeware | Size: 307.2 KB | Download (92): MoioChart Download |
Released: October 25, 2012
|
Added: October 25, 2012 | Visits: 498
 RLPlot is is a plotting program to create high quality graphs from data. Based on values stored in a spreadsheet several menus help you to create graphs of your choice. The Graphs are displayed as you get them (wysiwyg). Double click any element of the graph (or a single click with the right...
Platforms: Windows
| License: Freeware | Size: 1.2 MB | Download (455): RLPlot for Mac OS X Download |
Released: September 12, 2012
|
Added: September 12, 2012 | Visits: 505
 Versatile Biorhythm plotting software with user friendly interface and print option for generated graphs and report. Full month graphical display of Primary (Physical, Emotional and Intellectual) and Secondary (Intuitional (or Intuitive), Aesthetic, (Self)Awareness and Spiritual) cycles....
Platforms: Windows
| License: Freeware | Size: 482 KB | Download (47): RitmoView Free Download |
Released: January 11, 2013
|
Added: January 11, 2013 | Visits: 466
 Graphs is a handy graphing add-on you can use with SharePoint. It supports both line graphs and pie charts and is capable of directly connecting to SharePoint lists. Easy-to-use visualization web part that can connect directly to your list data. And the best thing - it's free!!
FEATURES:
·...
Graphs is a handy graphing add-on you can use with SharePoint. It supports both line graphs and pie charts and is capable of directly connecting to SharePoint lists. Easy-to-use visualization web part that can connect directly to your list data. And the best thing - it's free!!
FEATURES:
·...
Platforms: Windows
| License: Freeware | Size: 369 KB | Download (57): Graphs Download |
Released: December 10, 2012
|
Added: December 10, 2012 | Visits: 514
APLpy (the Astronomical Plotting Library in Python) is a Python module aimed at producing publication-quality plots of astronomical imaging data in FITS format. Visit http://aplpy.sourceforge.net/ for tutorials and documentation.
Platforms: Mac, Linux
| License: Freeware | Size: 55.36 KB | Download (46): APLpy (Astronomical Plotting in Python) Download |
Released: November 18, 2012
|
Added: November 18, 2012 | Visits: 420
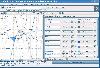 FunkyPlot is an interactive plotting tool for mathematical functions, designed for pupils and students.
Platforms: Windows, Mac, Linux
| License: Freeware | Size: 776.03 KB | Download (50): FunkyPlot - Math. Function Plotting Download |