


Plot freeware
Plot
Released: July 09, 2012
|
Added: July 09, 2012 | Visits: 404
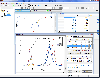
 TableView is a small, simple application specially designed to help you with the visualization of genomic data.
TableView can present data in spreadsheet format, which lets you sort, copy and paste rows, etc.
It also lets you view scatter plots comparing columns in the spreadsheet. And when...
TableView is a small, simple application specially designed to help you with the visualization of genomic data.
TableView can present data in spreadsheet format, which lets you sort, copy and paste rows, etc.
It also lets you view scatter plots comparing columns in the spreadsheet. And when...
Platforms: Windows
| License: Freeware | Download (411): TableView Download |
Released: July 20, 2012
|
Added: July 20, 2012 | Visits: 563
 MagicPlot is a handy tool for scientific and engineer data processing, plotting and nonlinear fitting. MagicPlot is powerful enough and consistent.
Advantages
* Compact: Single file ~2 MB
* Multilevel undo function for all actions
* Useful plot navigation and scaling
* Visual nonlinear...
MagicPlot is a handy tool for scientific and engineer data processing, plotting and nonlinear fitting. MagicPlot is powerful enough and consistent.
Advantages
* Compact: Single file ~2 MB
* Multilevel undo function for all actions
* Useful plot navigation and scaling
* Visual nonlinear...
Platforms: All
| License: Freeware | Size: 2.2 MB | Download (391): MagicPlot Student for Mac OS X Download |
Released: April 11, 2009
|
Added: April 14, 2009 | Visits: 1.722
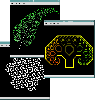 Scato (Scalable Tortoise) is a programming language to drive the tortoise, that can draw lines with different width and colors. Scato is designed to plot iterated function system (IFS), L-systems, Penrose tile, and similar kinds of fractal objects. It's arm to make easy to scale and rotate parts...
Platforms: Windows
| License: Freeware | Size: 87.31 KB | Download (344): Scato Download |
Released: November 11, 2007
|
Added: March 24, 2008 | Visits: 4.919
 Area converter and price calculator software is available free of cost. Tool installation wizard makes easy to install the software on your computer on various version of windows operating system like 98, ME, NT, 2000, 2003 server, XP, VISTA. Software can figure out cost of shop, office, homes,...
Platforms: Windows
| License: Freeware | Size: 759 KB | Download (302): Area Conversion and Price Calculator Download |
Released: December 31, 2007
|
Added: January 01, 2008 | Visits: 3.084
 SpeQ is a small, extensive mathematics program with a simple, intuitive interface. All calculations are entered in a sheet. In there you can freely add, edit and execute all calculations. You can define variables and functions, and plot graphs of your functions. You can save your calculations for...
Platforms: Windows
| License: Freeware | Size: 497.77 KB | Download (293): SpeQ Mathematics Download |
Added: August 30, 2008 | Visits: 1.361
Graphically plot/compute/explore/print different types of mathematical equations. Plot/print - normal, parametric, implicit, functions; Compute function/polynomial thru set of 1..40 dots; Use constants a,b,c, change them with a mouse click, graphics adjust automatically creating a movie like...
Platforms: Windows
| License: Freeware | Size: 484 KB | Download (270): Graphics-Explorer Download |
Released: May 01, 2012
|
Added: May 10, 2012 | Visits: 2.147
SimplexNumerica is an object-oriented numerical data analyzer, plot and presentation program. SimplexNumerica is proving to be extremely popular among scientists. Ergonomic programming using the newest Windows programming guidelines with toolbars, context dialogs and interactive diagrams...
Platforms: Windows
| License: Freeware | Size: 21.77 MB | Download (248): SimplexNumerica Download |
Released: August 05, 2015
|
Added: March 05, 2016 | Visits: 2.638
 Which estimator is best for your job? Helps Find best Spectral Estimation Method for a Power Spectral Density plot. A menu of 10+ spectral estimators from Steve Kay's textbook 'Modern Spectral Estimation' 1988 is available to choose from. The results differ dramatically from one estimator to...
Platforms: Windows, Windows 8, Windows 7, Windows Server
| License: Freeware | Size: 3.18 MB | Download (226): SpectrumSolvers Download |
Released: January 21, 2009
|
Added: January 27, 2009 | Visits: 1.184
 You have awoken in a mysterious cavern with the only escape route too narrow to fit through. Armed only with your wits you must use whatever objects you find along with the surrounding environment to plot your escape.
Use the mouse to interact with the environment and items in your...
You have awoken in a mysterious cavern with the only escape route too narrow to fit through. Armed only with your wits you must use whatever objects you find along with the surrounding environment to plot your escape.
Use the mouse to interact with the environment and items in your...
Platforms: Windows
| License: Freeware | Size: 3.58 MB | Download (165): Cavern Escape Download |
Added: January 09, 2010 | Visits: 2.549
Chart::Plot::Canvas is a Perl module to plot two dimensional data in an Tk Canvas. SYNOPSIS use Chart::Plot::Canvas; my $img = Chart::Plot::Canvas->new(); my $anotherImg = Chart::Plot::Canvas->new ($image_width, $image_height); $img->setData (@dataset) or die( $img->error() );...
Platforms: *nix
| License: Freeware | Size: 5.12 KB | Download (162): Chart::Plot::Canvas Download |
Released: March 06, 2015
|
Added: November 28, 2015 | Visits: 21.432
 PTC Mathcad Express is free-for-life engineering math software. You get unlimited use of the most popular capabilities in PTC Mathcad - the most powerful technical calculation software available. Easily solve, document, share and reuse vital calculations.
If you download and choose the trial...
PTC Mathcad Express is free-for-life engineering math software. You get unlimited use of the most popular capabilities in PTC Mathcad - the most powerful technical calculation software available. Easily solve, document, share and reuse vital calculations.
If you download and choose the trial...
Platforms: Windows, Windows 8, Windows 7, Windows Server
| License: Freeware | Size: 1.06 GB | Download (137): PTC Mathcad Express Download |
Added: July 27, 2010 | Visits: 1.555
IP-Atlas tries to plot your location or any other host on the internet using the NetGeo data. It finds the latitude and longitude coordinates of the host and plots it on an image for you.It finds the latitude and longitude coordinates of the host and plots it on an image for you. You can try the...
Platforms: *nix
| License: Freeware | Size: 93.18 KB | Download (128): IP-Atlas Download |
Added: May 08, 2009 | Visits: 1.119
The Plot:COF is the next step in TV-Entertainment after Big Br*ther. You take the roll as a "Defender" (special kind government official) who has to defend a wall against incoming "Climbers" (volunteers hoping for medical attention). Refer to the Readme.txt for the full story. The Game: COF is a...
Platforms: Windows
| License: Freeware | Size: 2.3 MB | Download (123): Climbers of Fortune Download |
Released: July 07, 2012
|
Added: July 07, 2012 | Visits: 916
 Universal oscilloscope GUI ( Real-time plot ) DLL library for data acquisition, simulation, debugging.Advantages:1.Speedy performance: the library makes it possible to bring out into the beams of the viewing oscilloscope over a million quantization steps of signal per second (on the Pentium III...
Platforms: Windows, Windows Vista
| License: Freeware | Size: 3.54 MB | Download (121): Universal Software Oscilloscope Library Download |
Added: January 22, 2010 | Visits: 1.649
Chart::Plot is a Perl module to plot two dimensional data in an image. SYNOPSIS use Chart::Plot; my $img = Chart::Plot->new(); my $anotherImg = Chart::Plot->new ($image_width, $image_height); $img->setData (@dataset) or die( $img->error() ); $img->setData (@xdataset, @ydataset);...
Platforms: *nix
| License: Freeware | Size: 15.36 KB | Download (116): Chart::Plot Download |
Added: January 25, 2010 | Visits: 825
Plot is a scientific 2D plotting program for Mac OS X. Plot is designed for everyday plotting, it is easy to use, it creates high quality plots, it allows easy and powerful manipulations and calculations of data, and it is free.Available Features: ASCII, Binary, MySQL, SciPlot and Perl based...
Platforms: Mac
| License: Freeware | Download (115): Plot Download |
Added: February 08, 2010 | Visits: 1.263
Chemistry::Artificial::Graphics is a graphic plot for artificial with database support. SYNOPSIS use strict; use Chemistry::SQL; use Chemistry::Artificial::Graphics; my $dbname = $ARGV[0]; my $chaname = $ARGV[1]; my $file = $ARGV[2]; my $mode = $ARGV[3]; if (scalar(@ARGV)!=4) {...
Platforms: *nix
| License: Freeware | Size: 14.34 KB | Download (112): Chemistry::Artificial::Graphics Download |
Added: October 14, 2010 | Visits: 1.652
GD::Graph is a graph plotting module for Perl 5. SYNOPSIS use GD::Graph::moduleName; GD::Graph is a perl5 module to create charts using the GD module. The following classes for graphs with axes are defined: GD::Graph::lines Create a line chart. GD::Graph::bars and GD::Graph::hbars...
Platforms: *nix
| License: Freeware | Size: 143.36 KB | Download (111): GD::Graph Download |
Added: January 13, 2010 | Visits: 1.369
Chart::Scientific is a Perl module that can generate simple 2-D scientific plots with logging, errbars, etc. SYNOPSIS Procedural interface use Chart::Scientific qw/make_plot/; make_plot ( x_data => @x_values, y_data => @yvalues ); The subroutine make_plot creates a Chart::Scientific...
Platforms: *nix
| License: Freeware | Size: 16.38 KB | Download (109): Chart::Scientific Download |
Added: April 03, 2010 | Visits: 1.420
PDL::Graphics::PGPLOT::Window is a OO interface to PGPLOT windows. SYNOPSIS perldl> use PDL::Graphics::PGPLOT::Window perldl> $win = PDL::Graphics::PGPLOT::Window->new(Device => /xs); perldl> $a = pdl [1..100] perldl> $b = sqrt($a) perldl> $win->line($b) perldl> $win->hold() perldl> $c...
Platforms: *nix
| License: Freeware | Size: 1.1 MB | Download (106): PDL::Graphics::PGPLOT::Window Download |