


Olap Visualization freeware
Olap Visualization
Released: August 16, 2012
|
Added: August 16, 2012 | Visits: 406
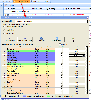
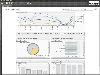 OpenI plugin for Pentaho CE provides a simple and clean user interface to visualize data in OLAP cubes. It supports both direct Mondrian and xmla based connections like Microsoft SQL Server Analysis Services (SSAS), plus provides add-on features like Explore Cube Data, custom SQL for drillthrough...
Platforms: Windows, Mac, Linux
OpenI plugin for Pentaho CE provides a simple and clean user interface to visualize data in OLAP cubes. It supports both direct Mondrian and xmla based connections like Microsoft SQL Server Analysis Services (SSAS), plus provides add-on features like Explore Cube Data, custom SQL for drillthrough...
Platforms: Windows, Mac, Linux
| License: Freeware | Size: 8.16 MB | Download (50): OpenI: OLAP Data Visualization Plugin Download |
Added: June 25, 2010 | Visits: 1.027
 XMMS Root Visualization Plugin is a little XMMS plugin wich can draw a spectrum analyzer directly to the background (root window) of X. Whats New in This Release: - changed code to get rid of gcc 4 compiler warnings - added alpha channel to all colors - rewrote configuration backend -...
Platforms: *nix
XMMS Root Visualization Plugin is a little XMMS plugin wich can draw a spectrum analyzer directly to the background (root window) of X. Whats New in This Release: - changed code to get rid of gcc 4 compiler warnings - added alpha channel to all colors - rewrote configuration backend -...
Platforms: *nix
| License: Freeware | Size: 337.92 KB | Download (108): XMMS Root Visualization Plugin Download |
Released: April 29, 2010
|
Added: May 17, 2010 | Visits: 1.445
 OLAP Statistics for Microsoft Outlook enables you to select both Outlook and user-defined custom fields of interest, and then explore them in a multi-dimensional view with the capability of complex calculations, trend analysis and sophisticated data modeling, all from inside your Outlook. The...
Platforms: Windows
OLAP Statistics for Microsoft Outlook enables you to select both Outlook and user-defined custom fields of interest, and then explore them in a multi-dimensional view with the capability of complex calculations, trend analysis and sophisticated data modeling, all from inside your Outlook. The...
Platforms: Windows
| License: Freeware | Size: 8.49 MB | Download (101): OLAP Statistics for Outlook Download |
Released: July 01, 2012
|
Added: July 01, 2012 | Visits: 788
Visualization in Geometric Knot Theory is a small, Java based application specially designed to help you create different interactive visualizations in geometric knot theory.
Most of the software's options are available via the context menu of corresponding components and their toolbars and...
Platforms: Windows
| License: Freeware | Download (422): Visualization in Geometric Knot Theory Download |
Released: August 17, 2012
|
Added: August 17, 2012 | Visits: 675
 OLAP Statistics & Reporting for SharePoint enables you to connect to a SharePoint list, task or calendar and explore data in a multi-dimensional grid, pivot tables, filters, and graph or chart view. You can run this OLAP analysis tool on on each SharePoint list, with its own unique set of fields....
Platforms: Windows
OLAP Statistics & Reporting for SharePoint enables you to connect to a SharePoint list, task or calendar and explore data in a multi-dimensional grid, pivot tables, filters, and graph or chart view. You can run this OLAP analysis tool on on each SharePoint list, with its own unique set of fields....
Platforms: Windows
| License: Freeware | Size: 5.65 MB | Download (49): OLAP Statistics for SharePoint Download |
Released: October 04, 2012
|
Added: October 04, 2012 | Visits: 832
OLAP Statistics & Reporting for Microsoft SharePoint is a powerful and reliable solution designed to enable you to connect to a SharePoint list, task or calendar and explore data in a multi-dimensional grid, pivot tables, filters, graph or chart view.
With the capability of complex...
Platforms: Windows
| License: Freeware | Download (51): OLAP Statistics and Reporting for SharePoint Download |
Released: September 27, 2012
|
Added: September 27, 2012 | Visits: 825
 The Visualization Toolkit (VTK) is an open-source, freely available software system for 3D computer graphics, image processing and visualization. VTK consists of a C++ class library and several interpreted interface layers including Tcl/Tk, Java, and Python. Kitware, whose team created and...
Platforms: Windows, Mac, Linux
The Visualization Toolkit (VTK) is an open-source, freely available software system for 3D computer graphics, image processing and visualization. VTK consists of a C++ class library and several interpreted interface layers including Tcl/Tk, Java, and Python. Kitware, whose team created and...
Platforms: Windows, Mac, Linux
| License: Freeware | Size: 10 MB | Download (54): Visualization Toolkit (VTK) Download |
Released: August 20, 2012
|
Added: August 20, 2012 | Visits: 861
 Power Engineering Visualization VC++ Source Code Solutions
UCanCode Softwareis a world-class Power Engineering Solutions provider with an established reputation for customer responsiveness and technical expertise. Our solutions stand behind thousands of T&D projects in over 40 countries around...
Platforms: Windows
Power Engineering Visualization VC++ Source Code Solutions
UCanCode Softwareis a world-class Power Engineering Solutions provider with an established reputation for customer responsiveness and technical expertise. Our solutions stand behind thousands of T&D projects in over 40 countries around...
Platforms: Windows
| License: Freeware | Size: 491.52 KB | Download (48): Power Engineer Visualization Component Download |
Released: October 20, 2012
|
Added: October 20, 2012 | Visits: 591
 PMN Solution Visualization .NET/VC++ Source Code Kit
-- Build Advanced Diagrams and Dashboards for Business Process Management (BPM) in minutes
Business Process Modeling (BPM) is typically performed by business analysts who are seeking to improve process efficiency. Process oriented...
Platforms: Windows
PMN Solution Visualization .NET/VC++ Source Code Kit
-- Build Advanced Diagrams and Dashboards for Business Process Management (BPM) in minutes
Business Process Modeling (BPM) is typically performed by business analysts who are seeking to improve process efficiency. Process oriented...
Platforms: Windows
| License: Freeware | Size: 491.52 KB | Download (49): UCC BPMN Visualization Component Download |
Released: July 12, 2012
|
Added: July 12, 2012 | Visits: 311
 OLAP mapper is an OLAP engine written in Java. It enables you to interactively analyze very large datasets stored in SQL databases without writing SQL. The main concept of application is based on the star schema visualization.
Platforms: Windows, Mac, Linux
OLAP mapper is an OLAP engine written in Java. It enables you to interactively analyze very large datasets stored in SQL databases without writing SQL. The main concept of application is based on the star schema visualization.
Platforms: Windows, Mac, Linux
| License: Freeware | Size: 17.9 MB | Download (53): Olap Mapper Download |
Added: April 26, 2013 | Visits: 782
The code in this submission describes how to download and install the Visualization Toolkit (VTK, www.vtk.org) and create a MATLAB mex file to interface with it.An example C++ mex file and code to build and run the mex file are included.
Platforms: Matlab
| License: Freeware | Size: 10 KB | Download (46): Visualization Toolkit (VTK) mex interface Download |
Added: August 16, 2013 | Visits: 608
This is the data set you will need to participate in the Data Visualization contest. For more information, refer to the rules posted here. http://www.mathworks.com/contest/datavis/rules.htmlYou can also follow the latest announcements on the contest blog here. http://blogs.mathworks.com/contest/
Platforms: Matlab
| License: Freeware | Size: 1.3 MB | Download (48): MATLAB Contest - Data Visualization Download |
Added: August 14, 2008 | Visits: 3.159
Open Visualization Data Explorer is a visualization framework that gives users the ability to apply advanced visualization and analysis techniques to their data. These techniques can be applied to help users gain new insights into data from applications in a wide variety of fields including...
Platforms: All
| License: Freeware | Size: 7.6 MB | Download (783): Open Visualization Data Explorer Download |
Released: August 04, 2012
|
Added: August 04, 2012 | Visits: 747
RadarCube is a fast and powerful ASP.NET OLAP control offering you with a unique chance of supplying the web site with the MS Analysis 2000 or 2005 client abilities.
RadarCube ASP.NET OLAP control for MS AS is entirely authored in C# 2.0 and can be an excellent substitute for the OWC PivotTable...
Platforms: Windows
| License: Freeware | Download (51): RadarCube ASP.NET OLAP control for MS AS Download |
Released: October 09, 2012
|
Added: October 09, 2012 | Visits: 749
 Data Visualization is a free generic cross platform tool that allows the user to create documents in an easy way. You can easily create layout of the document and import data from almost any data base (Oracle, MySQL, PostgreSQL, Firebird, MS SQL Server, IBM DB2, Interbase, SQLite) or from...
Platforms: Windows, Mac, Java, Linux, Linux Gnome, Linux GPL, Linux Open Source, MS-DOS, Unix, Other
Data Visualization is a free generic cross platform tool that allows the user to create documents in an easy way. You can easily create layout of the document and import data from almost any data base (Oracle, MySQL, PostgreSQL, Firebird, MS SQL Server, IBM DB2, Interbase, SQLite) or from...
Platforms: Windows, Mac, Java, Linux, Linux Gnome, Linux GPL, Linux Open Source, MS-DOS, Unix, Other
| License: Freeware | Size: 14.84 MB | Download (52): Data Visualization Download |
Released: July 07, 2012
|
Added: July 07, 2012 | Visits: 529
 The Business Continuity Visualization Toolkit assists in the assessment of Business Continuity projects and helps to translate dry technical relationships into colorful pictures suitable for management presentations and board decisions.
Platforms: Windows, Mac, Linux
The Business Continuity Visualization Toolkit assists in the assessment of Business Continuity projects and helps to translate dry technical relationships into colorful pictures suitable for management presentations and board decisions.
Platforms: Windows, Mac, Linux
| License: Freeware | Size: 1023.5 KB | Download (45): Business Continuity Visualization Tool Download |
Released: July 24, 2012
|
Added: July 24, 2012 | Visits: 565
The Comics project allows local downloading and visualization of comics found on the web.
Platforms: Windows, Mac, Linux
| License: Freeware | Size: 39.63 KB | Download (45): Comics visualization project Download |
Released: October 13, 2012
|
Added: October 13, 2012 | Visits: 361
The Graph Visualization Framework is a set of Java 2 packages that canserve as a foundation for applications that manipulate or visualize graph structures. 'Royere' is built on the GVF and includes XMLsupport, SVG output, pluggable layouts, editing.
Platforms: Windows, Mac, Linux
| License: Freeware | Size: 5.4 MB | Download (44): Graph Visualization Framework Download |
Released: December 16, 2012
|
Added: December 16, 2012 | Visits: 368
Graphl is a generic graph visualization and manipulation tool written in Java. Graphl reads and writes RDF files, visualizes them in a flexible and customizeable way and allows users to edit them intuitively. Please see project homepage for more info...
Platforms: Windows, Mac, Linux
| License: Freeware | Size: 320.2 KB | Download (46): Graphl - Hybrid graph visualization tool Download |
Released: July 08, 2012
|
Added: July 08, 2012 | Visits: 420
 JMagallanes is an open source end user application for Olap and Dynamic Reports written in Java/J2EE. Combines static reports, pivot table and charts. It reads from SQL and other data sources.
Platforms: Windows, Mac, Linux
JMagallanes is an open source end user application for Olap and Dynamic Reports written in Java/J2EE. Combines static reports, pivot table and charts. It reads from SQL and other data sources.
Platforms: Windows, Mac, Linux
| License: Freeware | Size: 12.92 MB | Download (45): JMagallanes Olap and Report Download |