


Graphs Plotting freeware
Graphs Plotting
Added: May 25, 2013 | Visits: 517
 GraPHPite is a highly customizable utility written in PHP for creating charts or graphs (Bar, Area, Pie, etc). Users are encouraged to switch to PEAR::Image_Graph which is based on GraPHPite source. GraPHPite is in maintenance only state.
Platforms: PHP
| License: Freeware | Size: 1.01 MB | Download (49): GraPHPite for Scripts Download |
Released: July 10, 2012
|
Added: July 10, 2012 | Visits: 419
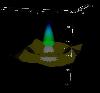 Pyllar is a 3D plotting library for the Python programming language. It uses the Visualization Toolkit (VTK) and PyNum library provide high quality 3D plots for science and engineering.
Platforms: Windows, Mac, Linux
| License: Freeware | Size: 490.86 KB | Download (48): Pyllar Plotting Library Download |
Added: May 10, 2013 | Visits: 219
The graphs are accessible under Administer > Logs > Graphs.Installation - Unpack in your modules folder (usually /sites/all/modules/) and enable under Administer > Site Building > Modules. Requirements: - Drupal 5.x
Platforms: Windows, Mac, *nix, PHP, BSD Solaris
| License: Freeware | Download (48): Graphstat Download |
Added: August 12, 2013 | Visits: 473
This workbook teaches students how to use MATLAB and Simulink to perform calculations and generate graphs essential to control system analysis.For a full book description and ordering information, please refer to http://www.mathworks.com/support/books/book1301.jsp.
Platforms: Matlab
| License: Freeware | Size: 51.2 KB | Download (48): Using MATLAB to Analyze and Design Control Systems, 2e Download |
Added: August 01, 2013 | Visits: 446
Cacti is a complete frontend to RRDTool, it stores all of the necessary information to create graphs and populate them with data in a MySQL database.The frontend is completely PHP driven. Along with being able to maintain Graphs, Data Sources, and Round Robin Archives in a database, cacti handles...
Platforms: PHP
| License: Freeware | Size: 1.07 MB | Download (48): Cacti - RRDTool Interface for Scripts Download |
Released: September 12, 2012
|
Added: September 12, 2012 | Visits: 501
 Versatile Biorhythm plotting software with user friendly interface and print option for generated graphs and report. Full month graphical display of Primary (Physical, Emotional and Intellectual) and Secondary (Intuitional (or Intuitive), Aesthetic, (Self)Awareness and Spiritual) cycles....
Platforms: Windows
| License: Freeware | Size: 482 KB | Download (47): RitmoView Free Download |
Added: May 01, 2013 | Visits: 350
Maple is a great tool for symbolic manipulation and is also very smart at plotting expressions, handling discontinuities,etc.However the plot customization and export possibilities are very primitive. Also, often I want to superimpose Maple plots with other data. This is very clumsy to handle in...
Platforms: Matlab
| License: Freeware | Size: 10 KB | Download (47): ReadMaplePlot Download |
Added: April 20, 2013 | Visits: 728
The 2D / 3D Line Graph provides both a client and server side solution for the incorporation of line graphs and charts into web pages.It provides versatile components so that web authors and Java developers can easily build and publish dynamic and interactive line charts.Both the applet and...
Platforms: PHP
| License: Freeware | Size: 358.4 KB | Download (47): 2D 3D Line Graph for Scripts Download |
Added: May 15, 2013 | Visits: 548
GraPHPite is a highly customizable utility written in PHP for creating charts or graphs (Bar, Area, Pie, etc). Users are encouraged to switch to PEAR::Image_Graph which is based on GraPHPite source. GraPHPite is in maintenance only state.
Platforms: PHP
| License: Freeware | Size: 1.01 MB | Download (47): GraPHPite Script Download |
Released: December 16, 2012
|
Added: December 16, 2012 | Visits: 542
JPlot is a multi-purpose data plotting program for use as the graphic front-end of (scientific) software. JPlot is also available as a stand-alone application with a complete and easy-to-use graphic user interface (GUI).
Platforms: Windows, Mac, Linux
| License: Freeware | Size: 313.12 KB | Download (46): JPlot -- Graphical plotting software Download |
Released: June 27, 2012
|
Added: June 27, 2012 | Visits: 412
The Visualization of Protein-Ligand Graphs (VPLG) software package computes and visualizes protein graphs. It works on the super-secondary structure level and uses the atom coordinates from PDB files and the SSE assignments of the DSSP algorithm.
Platforms: Windows, Mac, BSD, Linux
| License: Freeware | Size: 6.6 MB | Download (46): Visualization of Protein-Ligand Graphs Download |
Added: May 15, 2013 | Visits: 465
There are 23 different functions performing basic orbital operations (Hohmann tx, inclination and node changes, orbital parameter conversions, ground tracks, orbit plotting, etc.). Some of these functions are still rough, so please provide feedback. These functions are basically how I did all of...
Platforms: Matlab
| License: Freeware | Size: 573.44 KB | Download (46): Orbital Mechanics Library Download |
Added: March 23, 2013 | Visits: 476
A Simple Pack of Tools for Plotting Lattices and Crystals and Calculating Their Properties. Description is in each file.
Platforms: Matlab
| License: Freeware | Size: 102.4 KB | Download (46): Solid State Physics Simulation Pack Download |
Added: July 01, 2013 | Visits: 360
This function graphs the neuron's weight and the input vectors. You can label the neurons and inputs, change the marker size, and color code the map to see which inputs activate which neurons (a visual representation of the approximation of the input field of a neuron in the adaptive network).
Platforms: Matlab
| License: Freeware | Size: 10 KB | Download (46): LABELNET Download |
Added: May 18, 2013 | Visits: 619
HTML-Graphs could be used to create horizontal / vertical bar graphs, progress bars and faders.You can create simple graphs and even grouped bar graphs with legends, add labels, change colors etc. No graphics ped bar gcal libraries are required.
Platforms: JavaScript
| License: Freeware | Size: 10 KB | Download (45): HTML-Graphs javascript Download |
Added: June 07, 2013 | Visits: 681
Use this script to create horizontal / vertical bar graphs, progress bars and faders.You can create simple graphs and even grouped bar graphs with legends, add labels, change colors etc. No graphics or graphical libraries required.This script was tested with PHP 4 5.
Platforms: PHP
| License: Freeware | Size: 10 KB | Download (45): HTML-Graphs (PHP) Download |
Released: December 10, 2012
|
Added: December 10, 2012 | Visits: 511
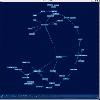
APLpy (the Astronomical Plotting Library in Python) is a Python module aimed at producing publication-quality plots of astronomical imaging data in FITS format. Visit http://aplpy.sourceforge.net/ for tutorials and documentation.
Platforms: Mac, Linux
| License: Freeware | Size: 55.36 KB | Download (45): APLpy (Astronomical Plotting in Python) Download |
Released: November 07, 2012
|
Added: November 07, 2012 | Visits: 350
 gxlbrowse is a simple utility that reads graphs in the GraphViz XML format (GXL) and presents them in an interactive browser.
Platforms: Windows, Mac, Linux
| License: Freeware | Size: 218 KB | Download (45): gxlbrowse - interactive graphviz graphs Download |
Added: August 31, 2013 | Visits: 551
Cacti is a complete frontend to RRDTool, it stores all of the necessary information to create graphs and populate them with data in a MySQL database.The frontend is completely PHP driven. Along with being able to maintain Graphs, Data Sources, and Round Robin Archives in a database, cacti handles...
Platforms: PHP
| License: Freeware | Size: 1.07 MB | Download (45): Cacti - RRDTool Interface Script Download |
Added: August 26, 2013 | Visits: 607
Use this script to create horizontal / vertical bar graphs, progress bars and faders.You can create simple graphs and even grouped bar graphs with legends, add labels, change colors etc. No graphics or graphical libraries required.This script was tested with PHP 4 5.
Platforms: PHP
| License: Freeware | Size: 10 KB | Download (44): HTML-Graphs (PHP) for Scripts Download |