


Flex Scatter Plot Chart freeware
Flex Scatter Plot Chart
Added: September 07, 2013 | Visits: 722
 About the ProjectProvides a "charts" style output for Views module so you can render result-set not just as text (list, tabular) but as pie-chart, bar-chart, scatter-plot etc.DC DrupalCon '09 Presentationhttp://vimeo.com/5306364Dependencies * Views 2 * Charts and GraphsSuggested modules * Views...
Platforms: PHP
| License: Freeware | Size: 10 KB | Download (46): Views Charts Download |
Released: July 09, 2012
|
Added: July 09, 2012 | Visits: 405
TableView is a small, simple application specially designed to help you with the visualization of genomic data.
TableView can present data in spreadsheet format, which lets you sort, copy and paste rows, etc.
It also lets you view scatter plots comparing columns in the spreadsheet. And when...
Platforms: Windows
| License: Freeware | Download (411): TableView Download |
Added: June 16, 2013 | Visits: 793
% Draws a scatter plot with a colorscale% representing the data density computed% using three methods%% INPUT VARIABLES:% x,y - are the data points% method - is the method used to calculate data densities:% 'circles' - uses circles with a determined area% centered at each data point% 'squares' -...
Platforms: Matlab
| License: Freeware | Size: 10 KB | Download (71): scatplot Download |
Added: August 29, 2008 | Visits: 1.855
MB Free Flying Star Feng Shui generates the flying star chart for you home based on Feng Shui principles. MB Free Flying Star Feng Shui determines the plot chart of your house from the date when your house was built. This program attempts to give you a detailed interpretation of the direction of...
Platforms: Windows
| License: Freeware | Size: 769 KB | Download (224): MB Free Flying Star Feng Shui Download |
Released: July 21, 2012
|
Added: July 21, 2012 | Visits: 757
Daniel's XL Toolbox is a free add-in for Microsoft® Excel® for researchers in the biomedical and other sciences. Its worksheet management features also make it a useful general-purpose addin.
There are several commercial software packages for scientific data analysis and presentation. While...
Platforms: Windows
| License: Freeware | Size: 8.2 MB | Download (505): XL Toolbox Download |
Added: April 12, 2013 | Visits: 440
ct_gearth is a new content type based on the Google Earth API. Users can attach .kml files to a node (with upload module), which in turn is displayed through the Google Earth API. If a user attaches several .kml files it is possible to choose between them via a drop-down box.This module is part...
Platforms: PHP
| License: Freeware | Size: 10 KB | Download (43): KML content type Download |
Added: September 03, 2010 | Visits: 2.141
SVG::Graph is a Perl module to visualize your data in Scalable Vector Graphics (SVG) format. SYNOPSIS use SVG::Graph; use SVG::Graph::Data; use SVG::Graph::Data::Datum; #create a new SVG document to plot in... my $graph = SVG::Graph->new(width=>600,height=>600,margin=>30); #and create...
Platforms: *nix
| License: Freeware | Size: 88.06 KB | Download (151): SVG::Graph Download |
Released: October 25, 2012
|
Added: October 25, 2012 | Visits: 1.034
 MB Star Astrology comprises of Star Sign, Flying Star Feng Shui, 9 Star Ki Astrology, Purple Star Astrology & Birth Star astrology softwares. Stars have a great influence on our lives with their cosmic vibrations. This influences the personality and behavior of individuals. Mystic Board aims to...
Platforms: Windows
| License: Freeware | Size: 2.83 MB | Download (514): MB Star Astrology Download |
Released: September 26, 2012
|
Added: September 26, 2012 | Visits: 313
 Simple OS X 'droplet' for quick data visualization. Drag-and-drop one or more text files containing series data and a simple scatter plot is generated containing each series with different symbols, legend, etc. GUI-less alternative to gnome PlotDrop.
Platforms: Mac
| License: Freeware | Size: 9.03 KB | Download (45): PlotDroppy Download |
Added: May 22, 2013 | Visits: 632
PLOTAUTOBD builds bifurcation diagrams as displayed by XPPAUT, from AUTO data saved in a DAT file by XPPAUT option File/All Info.Several built-in features allow to finely control the graphic output with the possibility to produce publication quality figures as well as to make bifurcation data...
Platforms: Matlab
| License: Freeware | Size: 440.32 KB | Download (51): plotautobd Download |
Added: May 31, 2013 | Visits: 613
Simulink model of 802.11b wireless LAN physical layer (baseband), supporting 1Mbps, 2Mbps, 5.5Mbps, and 11Mbps modes. Model includes framing, long and short preamble, DBPSK and DQPSK modulation, Barker code spreading, Complementary Code Keying (CCK), root raised-cosine pulse shaping, channel...
Platforms: Matlab
| License: Freeware | Size: 71.68 KB | Download (57): 802.11b PHY Simulink Model Download |
Added: September 10, 2013 | Visits: 389
clickfit_OH.m lets you mouse-click a series of datapoints on top of a (noisy) scatterplot and returns a spline or polynomial regression through the clicked dataseries. In addition the clicked series itself is returned.clickfit_OH.m uses an altered version of ginput.m (ginput_OH.m) that from the...
Platforms: Matlab
| License: Freeware | Size: 61.44 KB | Download (44): clickfit_OH for curve fitting by eye/hand Download |
Added: July 30, 2013 | Visits: 504
Passing & Bablok described this procedure in the 1983.This procedure is ideal if you want to compare 2 different methods (instrument) which measure the same chemical analyte in the same sample.Classical linear regression method assume that variables X and Y are normal distributed and with a...
Platforms: Matlab
| License: Freeware | Size: 583.68 KB | Download (44): Passing and Bablok regression Download |
Added: July 29, 2013 | Visits: 398
Timeline Map was built as a Views 2 style plug-in.It is based on Timemap.js project, so Timemap.js (from http://code.google.com/p/timemap/) has to be included in the moduled-deOaos js directory.It allows you to load one or more datasets onto both a map and a timeline simultaneously. Only items in...
Platforms: PHP
| License: Freeware | Size: 30.72 KB | Download (45): Timelinemap Download |
Added: January 22, 2010 | Visits: 1.653
Chart::Plot is a Perl module to plot two dimensional data in an image. SYNOPSIS use Chart::Plot; my $img = Chart::Plot->new(); my $anotherImg = Chart::Plot->new ($image_width, $image_height); $img->setData (@dataset) or die( $img->error() ); $img->setData (@xdataset, @ydataset);...
Platforms: *nix
| License: Freeware | Size: 15.36 KB | Download (116): Chart::Plot Download |
Added: January 09, 2010 | Visits: 2.551
Chart::Plot::Canvas is a Perl module to plot two dimensional data in an Tk Canvas. SYNOPSIS use Chart::Plot::Canvas; my $img = Chart::Plot::Canvas->new(); my $anotherImg = Chart::Plot::Canvas->new ($image_width, $image_height); $img->setData (@dataset) or die( $img->error() );...
Platforms: *nix
| License: Freeware | Size: 5.12 KB | Download (162): Chart::Plot::Canvas Download |
Added: January 13, 2010 | Visits: 1.371
Chart::Scientific is a Perl module that can generate simple 2-D scientific plots with logging, errbars, etc. SYNOPSIS Procedural interface use Chart::Scientific qw/make_plot/; make_plot ( x_data => @x_values, y_data => @yvalues ); The subroutine make_plot creates a Chart::Scientific...
Platforms: *nix
| License: Freeware | Size: 16.38 KB | Download (109): Chart::Scientific Download |
Added: June 02, 2013 | Visits: 636
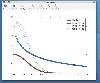
Show how to plot a Smith chart in Matlab. Show how to perform a 2 element match to 50 ohms termination using the Smith chart. Show that depending on the termination impedance that there is more than one combination of elements solving the problem.
Platforms: Matlab
| License: Freeware | Size: 1.74 MB | Download (55): Smith chart demo Download |
Added: January 18, 2010 | Visits: 2.266
Chart::Graph::Gnuplot is a function in module Chart::Graph that lets you generate graphs on the fly in perl. SYNOPSIS use Chart::Graph::Gnuplot qw(&gnuplot); gnuplot(%global_options, [%data_set_options, @matrix], [%data_set_options, @x_column, @y_column], [%data_set_options, < filename...
Platforms: *nix
| License: Freeware | Size: 8.19 KB | Download (173): Chart::Graph::Gnuplot Download |
Added: November 03, 2010 | Visits: 1.199
Chart::XMGR is a Perl object for displaying data via XMGR. SYNOPSIS use Chart::XMGR; xmgr($a, { SYMBOL => plus}; use Chart::XMGR (); $xmgr = new Chart::XMGR; $xmgr->line($pdl); $pdl->$xmgr->line; xmgr($pdl, { LINESTYLE => dotted }); Provides a perl/PDL interface to the XMGR...
Platforms: *nix
| License: Freeware | Size: 8.19 KB | Download (106): Chart::XMGR Download |