


X Y Graph software
X Y Graph
Added: November 22, 2006 | Visits: 4.582
 Rt-Plot is a tool to generate Cartesian X/Y-plots from scientific data. You can enter and calculate tabular data. View the changing graphs, including linear and non linear regression, interpolation, differentiation and integration, during entering. Rt-Plot enables you to create plots fast and...
Platforms: Windows
| License: Shareware | Cost: $50.00 USD | Size: 5.56 MB | Download (195): Rt-Plot Download |
Released: September 20, 2012
|
Added: September 20, 2012 | Visits: 916
 Python(x,y) is a free scientific and engineering development software for numerical computations, data analysis and data visualization based on Python programming language, Qt graphical user interfaces and Spyder interactive scientific development environment.
Platforms: Windows
| License: Freeware | Size: 75.6 MB | Download (64): Python(x,y) Download |
Released: August 08, 2012
|
Added: August 08, 2012 | Visits: 688
 The CRT X-Y library (libcrtxy) is meant to be used by video game programmers who wish to create games in the style of vector graphics arcade games of the late 1970s and early 1980s. (Tempest, Star Wars, Battle Zone, Star Castle, etc.)
Platforms: Windows, Mac, BSD, Linux
| License: Freeware | Size: 314.05 KB | Download (48): CRT X-Y Library (libcrtxy) Download |
Added: May 24, 2013 | Visits: 676
 P-x-y diagram using RK for Methane+ butane mixture
Platforms: Matlab
| License: Shareware | Cost: $0.00 USD | Size: 10 KB | Download (43): P-x-y diagram using RK for Methane+ butane mixture Download |
Added: August 06, 2013 | Visits: 520
This function generates mesh plot with 3Dbars at specific (x,y) points by using fill3 function.This function uses MATLAB's fill3.m meant to generate Filled 3-D polygons.
Platforms: Matlab
| License: Shareware | Cost: $0.00 USD | Size: 20.48 KB | Download (50): Generating surface plot with bars at specific (x,y) points Download |
Added: March 26, 2013 | Visits: 809
This being a very basic program for the demonstration of bubble and dew point calculations of a ideal binary VLE mixture obeying Raoult's. The basic purpose of this program is to demonstrate VLE P-T-x-y calculations of a ideal binary mixture and to get related data in graphical form for any such...
Platforms: Matlab
| License: Freeware | Size: 61.44 KB | Download (58): VAPOUR LIQUID EQUILIBRIUM P-T-x-y CALCULATIONS FOR A IDEAL BINARY MIXTURE Download |
Added: August 20, 2008 | Visits: 1.126
 Graph Digitizer Scout automatically converts hard-copy graphs, oscillograms, charts, plots, into X,Y. Different recognition methods including manual correction mode. Data can be exported to Excel, CSV format and other applications.
Platforms: Windows
| License: Demo | Cost: $35.00 USD | Size: 5.21 MB | Download (126): Graph Digitizer Scout Download |
Released: November 16, 2012
|
Added: November 16, 2012 | Visits: 452
 dcsDigitiser, a graph digitizer and densitometer, converts graphs into digital X-Y numerical numbers for peer analysis of graphs and gel in the open literature and/or of your own hard copies. With excellent performance, dcsDigitiser is accurate, precise, versatile and straightforward in its use....
Platforms: Windows
| License: Shareware | Cost: $120.00 USD | Size: 3.81 MB | Download (53): dcsDigitiser Graph Digitizer Densitomete Download |
Added: July 17, 2013 | Visits: 602
Often, measured data is comprised of N sampled values of z, evaluated at N locations (x,y). With this function, you can calculate the coefficients of the best-fit x,y polynomial using a linear least squares approximation.You can use this function if you have a set of N data triplets x,y,z, and...
Platforms: Matlab
| License: Shareware | Cost: $0.00 USD | Size: 10 KB | Download (53): 3D Least squares polynomial fit in x and y Download |
Added: September 21, 2013 | Visits: 392
A canvas that will draw an x,y line graph of one or multiple "datasets", you can modify almost every aspect of the resulting graph. Look at the included demo for an example. Not a replacement for excel :P but quite useful for simple graphs. Uses the XMLDictionary extension by Kevin Ballard to...
Platforms: Mac
| License: Shareware | Cost: $0.00 USD | Size: 133.12 KB | Download (45): GraphCanvas Download |
Added: August 24, 2008 | Visits: 1.807
 XYGraph is a native .NET charting component showing data in a cartesian graph (X,Y). Controls from componentXtra gives royalty free software integration. Both the free and purchased products includes sample code (VB and C#).
Platforms: Windows
| License: Freeware | Size: 390 KB | Download (162): XYGraph Download |
Added: August 20, 2008 | Visits: 1.194
ImageDIG consists of three integrated modules which allow the user to convert 2D flat images into 3D (x,y,z) data or if a graph, convert the graph in image form into 2 dimensional numerical data. The third module is a full analysis plotting utility where the user can import either the 2D or 3D...
Platforms: Windows
| License: Shareware | Cost: $49.95 USD | Size: 5.79 KB | Download (98): ImageDIG Download |
Released: November 26, 2012
|
Added: November 26, 2012 | Visits: 709
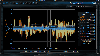 The Blue Cat's Oscilloscope Multi was designed to be a unique several tracks real-time waveform renderer and comparator: it will let you visualize the content of multiple audio tracks on the same screen, then compare them using its X-Y view. The plugin offers stereo or mid-side channels waveform...
Platforms: Mac
| License: Shareware | Cost: $48.25 USD | Size: 3.9 MB | Download (821): Blue Cat's Oscilloscope Multi for Mac OS X Download |
Added: August 19, 2013 | Visits: 466
[coef, RSquared]=plotfit(x,y,polyorder)A simple function that accepts x,y data pairs in in the vectors "x" and "y", fits it to a polynomial of order "polyorder", plots the data and the fit, and displays the fit coefficients and the goodness-of-fit measure R-squared in the upper left corner of the...
Platforms: Matlab
| License: Freeware | Size: 10 KB | Download (45): plotfit Download |
Added: April 28, 2013 | Visits: 479
MINimal CONNECTivity (adjacency) matrix for (X,Y) points on a plane, and/or graph of connections. Needs CLINE.Applications: graph theory, optimal traffic, astronomy (e.g. if youwant to see a tree of connected stars selected according to certain bounds on distance and/or magnitude etc).The...
Platforms: Matlab
| License: Freeware | Size: 10 KB | Download (43): MINCONNECT Download |
Added: July 14, 2013 | Visits: 331
Using variable precision integers, computes y such thatmod(x*y, N) == 1 is TRUE.
Platforms: Matlab
| License: Shareware | Cost: $0.00 USD | Size: 10 KB | Download (43): modinv(x, N) Download |
Added: July 07, 2013 | Visits: 369
function [coef, RSquared]=plotdata(xi,yi,polyorder) A simple data plotting function, useful for inspecting x,y data. The function accepts data in the form of a single vector, a pair of vectors "x" and "y", or a single NxM or MxN matrix with the independent variable (x) in first row or column...
Platforms: Matlab
| License: Shareware | Cost: $0.00 USD | Size: 10 KB | Download (49): plotdata, version 2 Download |
Added: July 09, 2013 | Visits: 472
XRG is an open source system monitor for Mac OS X. XRG allows you to monitor CPU activity, memory usage, battery status, machine temperature, network activity, disk I/O, current weather, and stock market data. The goal of XRG is to be a functional system monitor that has a clean and flexible...
Platforms: Mac
| License: Freeware | Size: 1.11 MB | Download (37): X Resource Graph (XRG) Download |
Added: November 01, 2006 | Visits: 14.957
 ImageDIG consists of three integrated modules which allow the user to convert 2D flat images into 3D (x,y,z) data or if a graph, convert the graph in image form into 2 dimensional numerical data. The third module is a full analysis plotting utility where the user can import either the 2D or 3D...
Platforms: Windows
| License: Shareware | Cost: $89.95 USD | Size: 5.67 MB | Download (580): ImageDIG 2D/3D image digitizer Download |
Added: May 10, 2013 | Visits: 207
This program digitizes plot into (x,y)-data. Using the program involves three main steps: import the graph from file, define coordinate axes and select points. After that you can save the data values into an ASCII file for later use. In order to learn more about how the program works, copy the...
Platforms: Matlab
| License: Shareware | Cost: $0.00 USD | Size: 153.6 KB | Download (43): GraphScannerGUI Download |