


X And Y Axis Grid software
X And Y Axis Grid
Released: September 17, 2012
|
Added: September 17, 2012 | Visits: 742
 First install and configure your web camera before using eViacam. It's very important to configure your camera in manual exposure mode and adjust this parameter to get about 25 fps or more. Most modern cameras can deliver 30fps. Please check your web camera manual when necessary. Once installed...
Platforms: Windows
| License: Freeware | Size: 3.8 MB | Download (49): Enable Viacam Download |
Released: November 07, 2012
|
Added: November 07, 2012 | Visits: 464
 Easy Panorama is simple and easy to use one image panorama viewer. Smooth and comfortable continuous rotation in both directions. You can use image of any width and height. Resizable. Speed and sens area customizable (x and y axis separately). Fully configurable via XML file. Main Features:...
Platforms: Windows, Mac, Other, Pocket PC, Android, BlackBerry, iPhone, iPod, iTouch, Palm
| License: Commercial | Cost: $10.00 USD | Size: 100 KB | Download (51): Easy Panorama Download |
Added: May 10, 2013 | Visits: 412
This class can be used to plot a graphic of a function given its expression.It can evaluate the given function for a given interval of x and y variable values and draw lines between the calculated points.The class also draws a grid of scale values as well the X and Y axis.More than one graphic...
Platforms: Windows, Mac, *nix, PHP,
| License: Freeware | Download (52): Bond's Math Graph Download |
Added: August 03, 2013 | Visits: 466
This is a small project aiming to prove a theory that grids can be solved using only the "possible value" method, whereby the numbers are filled in according the condition that that position has only one possible value, in filling this in, possible values matching this number on the same x and y...
Platforms: C and C plus plus
| License: Freeware | Size: 10 KB | Download (43): Sudoku Easy/Medium Solver Script Download |
Added: July 06, 2013 | Visits: 727
3D Array Factor of a 4x4 planar array antenna calculated using general formulas and then plotted in 3D format."AB" shows the excitation amplitude of the elements and "AB_phase" shows their phases.Elements are placed on the x and y axis and element factor is ignored. The code can easily be...
Platforms: Matlab
| License: Freeware | Size: 10 KB | Download (52): 3D Array Factor of a 4x4 planar array antenna Download |
Added: July 30, 2013 | Visits: 590
Generates random 2D-paths between start and finish nodes according to densities distribution given by matrix C with leg's contrainsts defined by the adjacency matrix I.P = path_generator(start , finish , I , [C] , [K] , [V] , [delta]);Inputs-------start Index of starting points (r x 1) where...
Platforms: Matlab
| License: Freeware | Size: 20.48 KB | Download (44): 2D random paths generator integrating leg's contraints Download |
Added: September 01, 2013 | Visits: 403
ORTHLLS2D returns the Orthogonal Linear Least Squares estimate for parameters of line a x + b y + c = 0function f = OrthLLS2D(x, y)Inputs x and y must be real vectors of equal size.Output f is the real vector [a b c] where a, b and c are the estimated parameters of the linear equation.Since a...
Platforms: Matlab
| License: Shareware | Cost: $0.00 USD | Size: 10 KB | Download (42): Analytical solution for Orthogonal Linear Least Squares in two dimensions Download |
Added: May 04, 2013 | Visits: 155
This is basically a wrapper to the pcolor routine which pads the arrays passed to pcolor so that the full array is plotted. It also centers the ticks on the pixels rather than on the edges. The EdgeColor is set to 'none.' This is good for plotting data on a grid when you don't want any...
Platforms: Matlab
| License: Shareware | Cost: $0.00 USD | Size: 10 KB | Download (40): pixplot Download |
Added: August 24, 2008 | Visits: 5.653
Graph Paper Maker is a free application that lets you create your own fragments of graph paper (special for graphic representations). If you need to often work with this type of paper at school or university, Graph Paper Maker will be very useful. The user has total control over the...
Platforms: Windows
| License: Freeware | Size: 1024 B | Download (691): Graph Paper Maker Download |
Added: June 18, 2013 | Visits: 1.098
Gplot is a simple Perl script. It accepts a large set of options to generate a single plot of one or more sets of data (overlaid as necessary). The X and Y axis will be scaled automatically.
Platforms: *nix
| License: Freeware | Size: 624.64 KB | Download (138): gplot Download |
Added: January 25, 2010 | Visits: 824
Plot is a scientific 2D plotting program for Mac OS X. Plot is designed for everyday plotting, it is easy to use, it creates high quality plots, it allows easy and powerful manipulations and calculations of data, and it is free.Available Features: ASCII, Binary, MySQL, SciPlot and Perl based...
Platforms: Mac
| License: Freeware | Download (115): Plot Download |
Released: July 16, 2012
|
Added: July 16, 2012 | Visits: 696
Software that lets you create your own custom sheets of graph paper. You have complete control over the graph characteristics:
- X and Y axis can independently be set for linear or log scale, and scaling
- Hydraulic scaling for graphing flow vs pressure.
- Selection from a dozen standard paper...
Platforms: Mac
| License: Freeware | Size: 5 MB | Download (62): Graph Paper Maker for Mac OS Download |
Added: April 18, 2013 | Visits: 456
On a plot with a lot of traces the standard legend will often scroll off the bottom or the side of the figure, this function is intended to overcome this by allowing the user to define a multi column format for the legend.Usage :legHdl =...
Platforms: Matlab
| License: Shareware | Cost: $0.00 USD | Size: 10 KB | Download (45): gridLegend - a multi column format for legends Download |
Added: April 12, 2013 | Visits: 394
The Alpert transform is a multiwavelets transform based on orthogonal polynomials. It was originally designed for the resolution of partial differential and integral equations, since it avoids boundary artifact and can be used with an arbitrary sampling.The reference for the numerical...
Platforms: Matlab
| License: Shareware | Cost: $0.00 USD | Size: 716.8 KB | Download (47): Toolbox Alpert Transform Download |
Added: September 15, 2013 | Visits: 195
function H=labelEdgeSubPlots(xl,yl,onlyBottom) Purpose If all subplots have the same quantities on the x and y axes then there's no point labeling all of them. Often it looks neater to simply have y labels only on the plots along the left hand edge and x labels only on the plots along the bottom....
Platforms: Matlab
| License: Shareware | Cost: $0.00 USD | Size: 10 KB | Download (43): labelEdgeSubPlots Download |
Added: April 03, 2013 | Visits: 353
Dirk-Jan KroonThis function opens an image file containing a plot. Then the origin, maximum X and Y axis, and data points can be manually and automatically selected to obtain a new vectorial plot (the animated screenshot shows the menus included).Using Image Processing Toolbox to open idexed and...
Platforms: Matlab
| License: Shareware | Cost: $0.00 USD | Size: 10 KB | Download (42): ReversePlot Download |
Added: June 19, 2013 | Visits: 265
This subsmission was inspired by the blog:http://blogs.mathworks.com/loren/2007/12/1...-pretty-graphs/SETAXES fixes common problems with MATLAB figures. SETAXES(AX, ...) applies to the axes AX which, when not supplied, defaults to the current axes. SETAXES('xoffset') [2-D view only] adjusts the...
Platforms: Matlab
| License: Shareware | Cost: $0.00 USD | Size: 10 KB | Download (44): SETAXES Download |
Added: August 01, 2013 | Visits: 400
This is a small program that creates a normalized 2-dimensional normal distribution, also known as a gaussian bell. The user has the options to decide the center of the distribution, the standard deviation, the size of the output matrix, and the area over which to create the distribution.I did...
Platforms: Matlab
| License: Shareware | Cost: $0.00 USD | Size: 10 KB | Download (39): Gaussian Bell Download |
Released: June 20, 2012
|
Added: August 30, 2012 | Visits: 1.806
 Graphs Made Easy (GME) is a free, easy to use program to make line, bar, pie, area, series bar and stack bar graphs.
It has a simplified, self-explanatory user-interface, and allows numbers or date values on the X-axis. It is designed to allow the easiest possible graph creation experience....
Graphs Made Easy (GME) is a free, easy to use program to make line, bar, pie, area, series bar and stack bar graphs.
It has a simplified, self-explanatory user-interface, and allows numbers or date values on the X-axis. It is designed to allow the easiest possible graph creation experience....
Platforms: Windows
| License: Freeware | Size: 2.29 MB | Download (165): Graphs Made Easy Download |
Released: October 07, 2012
|
Added: October 07, 2012 | Visits: 558
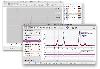 CrystalDiffract reads from saved crystal files, to simulate x-ray or neutron powder diffraction patterns on screen, with easy manipulation and measurement tools.
Real-time parameter controls let you experiment with diffraction and sample settings, with instant feedback. Combine these with...
CrystalDiffract reads from saved crystal files, to simulate x-ray or neutron powder diffraction patterns on screen, with easy manipulation and measurement tools.
Real-time parameter controls let you experiment with diffraction and sample settings, with instant feedback. Combine these with...
Platforms: Mac
| License: Demo | Cost: $299.00 USD | Size: 9.1 MB | Download (540): CrystalDiffract for Mac OS X Download |