


Spread Charting software
Spread Charting
Released: March 19, 2007
|
Added: September 24, 2014 | Visits: 10.004
 FusionCharts Free is a flash charting component that can be used to render data-driven & animated charts for your web applications and presentations.
It is a cross-browser and cross-platform solution that can be used with ASP.NET, ASP, PHP, JSP, ColdFusion, Ruby on Rails, simple HTML pages...
FusionCharts Free is a flash charting component that can be used to render data-driven & animated charts for your web applications and presentations.
It is a cross-browser and cross-platform solution that can be used with ASP.NET, ASP, PHP, JSP, ColdFusion, Ruby on Rails, simple HTML pages...
Platforms: Windows, Mac, *nix, Palm OS 6.0,Symbian
| License: Freeware | Size: 2.7 MB | Download (5270): FusionCharts Free Download |
Released: February 01, 2010
|
Added: April 29, 2014 | Visits: 1.506
 iPhoneChart.com Charting for iPad. Charting for iPad is a robust iPad charting SDK library to create & draw charts in iPad applications. This charting component provides most common charts for business data visulization. Charting for iPad
Platforms: iPhone,iTouch
| License: Shareware | Cost: $499.00 USD | Size: 195.31 KB | Download (2328): iPhoneChart Charting for iPad Download |
Released: August 08, 2019
|
Added: September 11, 2019 | Visits: 2.453
 AnyChart Stock and Financial JS Charts (short: AnyStock) is a JavaScript based financial and stock charting library, also used for visualizing any timeline data over a long time. AnyStock technology turns your real-time data into highly sophisticated charts with interactive features, bringing...
Platforms: Windows, Mac, *nix, Windows 8, Windows 7, Windows Server, iOS, Android, iPhone,iPad
| License: Shareware | Cost: $49.00 USD | Size: 17.81 MB | Download (1354): AnyStock Stock and Financial JS Charts Download |
Released: August 08, 2019
|
Added: September 14, 2019 | Visits: 3.783
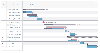 AnyGantt JS Gantt Charts library is an advanced JavaScript-based data visualization solution, allowing everyone to utilize power of animation and ultimate interactivity. AnyGantt is perfect for building complex and informative HTML5 Gantt charts.
AnyGantt is fully cross-browser and...
AnyGantt JS Gantt Charts library is an advanced JavaScript-based data visualization solution, allowing everyone to utilize power of animation and ultimate interactivity. AnyGantt is perfect for building complex and informative HTML5 Gantt charts.
AnyGantt is fully cross-browser and...
Platforms: Windows, Mac, *nix, Windows 8, Windows 7, Windows Server, iOS, Android, iPhone,iPad
| License: Shareware | Cost: $49.00 USD | Size: 17.81 MB | Download (1206): AnyGantt JS Gantt Charts Download |
Released: September 15, 2007
|
Added: November 12, 2007 | Visits: 4.541
 .NET Chart Designer is comprehensive charting application that supports more then 40 chart types in multiple modes, meaning that literally hundreds of different styles and types are available for users.The legend can be flexible integrated to the chart area. The multi-line headers and rotated...
Platforms: Windows
| License: Shareware | Cost: $39.99 USD | Size: 1.23 MB | Download (1015): .NET Chart Designer Download |
Added: August 26, 2006 | Visits: 6.291
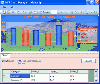
 Wall Street Analyzer is an advanced technical analysis charting system for financial markets, that will help you trading and take beter investment decision. It provides a broad set of technical analysis indicators (up to 30), customizable environment, it includes backtesting capabilities on your...
Platforms: Windows
| License: Freeware | Size: 1.92 MB | Download (885): Wall Street Analyzer Download |
Released: August 25, 2007
|
Added: June 16, 2009 | Visits: 3.852
 The Financial Charting Component is a specifically designed, high end stock charting component. Its great features include:
1. Written in 100 percent Visual C Sharp (CLS Compliant)
2. Integrated with Microsoft Visual Studio 2003 and 2005
3. Friendly usability and interactivity
4....
The Financial Charting Component is a specifically designed, high end stock charting component. Its great features include:
1. Written in 100 percent Visual C Sharp (CLS Compliant)
2. Integrated with Microsoft Visual Studio 2003 and 2005
3. Friendly usability and interactivity
4....
Platforms: Windows
| License: Commercial | Cost: $349.99 USD | Size: 4.24 MB | Download (576): Financial Charting Component Download |
Released: September 18, 2012
|
Added: September 18, 2012 | Visits: 705
 Stock charting and technical analysis software with a user-friendly interface targeted for stock investors and realtime traders. Supported dataproviders are Yahoo and Interactive Brokers. With the easy to use script language, you can create your own backtests, indicators, screener, real-time...
Platforms: Linux
| License: Freeware | Size: 31.08 MB | Download (512): TickInvest Free Edition for Linux Download |
Added: August 03, 2008 | Visits: 1.388
 3D Charting Toolkit is a powerful charting component solutioun used to create attractive, 3D and 2D charts for client applications and web pages using COM or .NET technologies. It uses the OpenGL engine to create 2D and 3D business, presentation and scientific charts. The package also includes a...
Platforms: Windows
| License: Shareware | Cost: $499.00 USD | Size: 51.9 MB | Download (478): 3D Charting Toolkit Download |
Released: September 14, 2012
|
Added: September 14, 2012 | Visits: 610
 VaryTable converts any selected text array on a CAD file (DXF, DWG, DGN, EMF, WMF) into spread sheet (XLS) cell table. VaryTable estimates table columns and rows by checking continuous blank area. This program is a handy productivity tool if you need to extract table data from drawings...
Platforms: Windows
| License: Shareware | Cost: $299.00 USD | Size: 10.72 MB | Download (459): VaryTable Download |
Released: November 02, 2009
|
Added: May 10, 2010 | Visits: 2.009
Used by HR professionals world-wide. OrgChart Professional can help you automate your organization charts so you can keep pace with re-organizations and frequent personnel changes. With our organization chart software, you can create org charts in minutes, track key employee information such as...
Platforms: Windows
| License: Demo | Cost: $59.99 USD | Size: 40.2 MB | Download (446): OrgChart Professional Download |
Released: January 18, 2013
|
Added: January 18, 2013 | Visits: 444
Ascetic is a simple Python and Matplotlib based Solaris monitoring and charting application. The tool may also be run in an offline mode on any major operating system.
Platforms: Windows
| License: Freeware | Size: 14.6 MB | Download (429): Ascetic Download |
Released: November 10, 2012
|
Added: November 10, 2012 | Visits: 828
 RBTI Data Charting Software is a tool for RBTI (Reams Biological Theory of Ionization) practitioners to store and track a full list of clients including the client information and all RBTI test results, which the software will calculate for you based on the raw data from your testing equipment....
Platforms: Mac
| License: Shareware | Cost: $195.00 USD | Size: 1.59 MB | Download (418): RBTI Data Charting for Mac OS X Download |
Released: October 12, 2012
|
Added: October 12, 2012 | Visits: 815
 RBTI Data Charting Software is a tool for RBTI (Reams Biological Theory of Ionization) practitioners to store and track a full list of clients including the client information and all RBTI test results, which the software will calculate for you based on the raw data from your testing equipment....
Platforms: Windows
| License: Shareware | Cost: $195.00 USD | Size: 1.7 MB | Download (413): RBTI Data Charting for Windows Download |
Released: November 03, 2008
|
Added: November 21, 2008 | Visits: 4.251
 Free Stock Charting Software with historical charts, technical analysis indicators and news. We have taken the open source eclipse trade and cleaned up a version specific to news and charts with technical analysis.
Platforms: Windows
| License: Freeware | Size: 26.68 MB | Download (380): Eclipse Stock Charts Lite Download |
Released: December 03, 2011
|
Added: December 08, 2011 | Visits: 2.215
 TickInvest is a stock charting and technical analysis software with realtime and eod charts.
Features: Backtester, Backtest Optimizer, Stock Screener, Alerts, Custom Drawing Tools, Stock Quotes, Extensible Formula Language.
Analyze your favorite stocks with ready to use Indicators or...
TickInvest is a stock charting and technical analysis software with realtime and eod charts.
Features: Backtester, Backtest Optimizer, Stock Screener, Alerts, Custom Drawing Tools, Stock Quotes, Extensible Formula Language.
Analyze your favorite stocks with ready to use Indicators or...
Platforms: Windows
| License: Shareware | Cost: $59.00 USD | Size: 32.89 MB | Download (292): TickInvest Download |
Released: November 05, 2007
|
Added: November 06, 2007 | Visits: 5.086
 CharTTool is an advanced stock charting software that instantly allows you to display several technical charts of stocks, mutual funds or indices. Intraday and end-of-day stock charting is available. The list of technical indicators includes Bollinger bands, price channels, moving averages, fast...
Platforms: Windows
| License: Shareware | Cost: $39.95 USD | Size: 1.07 MB | Download (267): CharTTool Download |
Released: January 20, 2009
|
Added: January 23, 2009 | Visits: 2.631
 FusionCharts for VB is a charting component for Microsoft® Visual Basic 6.0. It allows you to render interactive and animated charts in your Visual Basic applications. With the ability to render over 40 chart types spanning both 2D and 3D charts.
Platforms: Windows
| License: Demo | Cost: $99.00 USD | Size: 9.95 MB | Download (265): FusionCharts For VB Download |
Released: August 21, 2011
|
Added: September 08, 2011 | Visits: 1.631
 TickInvest is a stock charting and technical analysis software with realtime and eod charts.
29 Indicators are ready to use, to analyze your favorite stocks. Drawing tools helps you to keep track of
resistance and support zones. Realtime quotes informs you about stock price changes....
TickInvest is a stock charting and technical analysis software with realtime and eod charts.
29 Indicators are ready to use, to analyze your favorite stocks. Drawing tools helps you to keep track of
resistance and support zones. Realtime quotes informs you about stock price changes....
Platforms: Windows
| License: Demo | Cost: $0.00 USD | Size: 28.85 MB | Download (264): TickInvest Free Edition Download |
Added: November 02, 2010 | Visits: 1.645
linSmith project is a Smith Charting program, mainly designed for educational use. linSmith is a Smith Charting program, mainly designed for educational use. As such, there is an emphasis on capabilities that improve the showing the effect of-style of operation.. Computerized Smith chart with...
Platforms: *nix
| License: Freeware | Size: 962.56 KB | Download (252): linSmith Download |