


Scatter Plot Worksheet software
Scatter Plot Worksheet
Released: November 17, 2012
|
Added: November 17, 2012 | Visits: 639
 Need to generate random addition worksheets on the fly? Look no further. The Worksheet Creators by Brainormous are so loaded with features, you'll never be at a loss for a new worksheet for standard addition again. Includes:
- Answer keys with an ID code for easy organization
- Random problem...
Need to generate random addition worksheets on the fly? Look no further. The Worksheet Creators by Brainormous are so loaded with features, you'll never be at a loss for a new worksheet for standard addition again. Includes:
- Answer keys with an ID code for easy organization
- Random problem...
Platforms: Mac
| License: Freeware | Size: 3.6 MB | Download (496): Worksheet Creator: Addition for Mac OS Download |
Released: August 24, 2012
|
Added: August 24, 2012 | Visits: 555
 Coulson Plot Generator application creates a multiple pie diagram, for comparing subunit occupancy across a range of entities. Numbers of pies, segments, labels and colours are customisable. Creates an editable PDF from a comma separated text file.
Platforms: Windows, Mac, Solaris, Linux
| License: Freeware | Size: 150.49 KB | Download (47): Coulson Plot Generator Download |
Released: June 18, 2012
|
Added: June 18, 2012 | Visits: 345
Portable Plot is a pure ansi/iso c++ plot library that makes the construction of native plot widgets easy.
Platforms: Windows, Mac, Linux
| License: Freeware | Size: 456.67 KB | Download (45): portable plot Download |
Released: July 18, 2012
|
Added: July 18, 2012 | Visits: 437
Web SQL worksheet to maintain ANY SQL compliant DB which has a valid type 4 JDBC driver. Uses JSP technology and makes Database maintenance easier. Install on server/ nothing goes on client machines. Tested with Oracle, MySQL, SQLServer, and more.
Platforms: Windows, Mac, Linux
| License: Freeware | Size: 3.11 MB | Download (47): SQLWeb Worksheet 3000 Download |
Released: November 21, 2012
|
Added: November 21, 2012 | Visits: 427
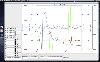 DAQ Plot is a simple to use strip chart application that permits real-time viewing and analysis of signals. Use simulated signals to understand data logging concepts without additional hardware and the inexpensive DLP-IO8-G data acquisition hardware (purc
Platforms: Mac
| License: Shareware | Cost: $14.99 USD | Size: 12.4 MB | Download (62): DAQ Plot Download |
Added: July 11, 2013 | Visits: 471
The available function to draw the Nyquist plot doesn't give the proper image of function. So here is the code to get the clear image.
Platforms: Matlab
| License: Freeware | Size: 10 KB | Download (39): Matlab, Nyquist, Power system, Plots, Nyquist plot. Download |
Added: July 11, 2013 | Visits: 284
%%%Plots a Bland-Altman Plot %%%INPUTS: %%% var1 and var2 - vectors of the measurements %%%flag - how much you want to plot %%% 0 = no plot %%% 1 = just the data %%% 2 = data and the difference and CR lines %%% 3 = above and a linear fit %%% %%%OUTPUTS: %%% means = the means of the data %%% diffs...
Platforms: Matlab
| License: Shareware | Cost: $0.00 USD | Size: 10 KB | Download (43): Bland Altman Plot Download |
Added: July 11, 2013 | Visits: 447
The script plots the envelope of the bode plot for a parametric uncertain/interval system.interval_bode(NumVec,DenVec,clr)The function accepts the numerator (NumVec) and denominator (DenVec) of the uncertain system as matrices of two rows each. The first row containing the lower bounds and the...
Platforms: Matlab
| License: Freeware | Size: 10 KB | Download (43): Interval Bode Plot Download |
Added: March 27, 2013 | Visits: 464
This function makes an imagesc-like plot for two matrices with equal dimensions, in which each each cell of the plot is split diagonally with the upper triangle of cell (i,j) in the plot representing the Matrix1(i,j) and the lower triangle representing Matrix2(i,j).
Platforms: Matlab
| License: Freeware | Size: 10 KB | Download (43): Overlay 2 matrices in an imagesc-like plot Download |
Added: June 21, 2013 | Visits: 497
You have to give it the coordinates of the ends, number of coils, natural length and radius and it gives to you the (xs,ys) coordinates of the spring points, ready to use it with plot(). The picture shows an instant image of an animation of two coupled-pendulums oscillating Type for usage. Don't...
Platforms: Matlab
| License: Freeware | Size: 10 KB | Download (43): Spring() To plot and animate a 2D-Spring Download |
Added: May 16, 2013 | Visits: 445
This function plot in the same figure the center trajectory and attitude of an aircraft. See the figure to understand better.The version 3.0, extend the functionality of version 2.In this last version :- fixed the Reference System Bugs- possibility to export the trajectory animation in avi format...
Platforms: Matlab
| License: Freeware | Size: 10 KB | Download (42): Trajectory and Attitude Plot Version 3 Download |
Added: March 28, 2013 | Visits: 442
Plot earth in 3D sphereSeveral maps and resolutions are availableMore comprehensive map collection is available athttp://www.mediafire.com/?m2mn1mgdngt
Platforms: Matlab
| License: Freeware | Size: 17.82 MB | Download (39): Plot earth Download |
Added: March 25, 2013 | Visits: 406
- Plot arithmetic and geometric Brownian motions- Plot Brownian bridges, 2D and 3D Brownian motions- Plot some random paths for the the interest spot rate: The two models you can chose from are the Vasicek and the Cox- Ingersoll-Ross (CIR) models
Platforms: Matlab
| License: Freeware | Size: 10 KB | Download (43): Plot Some Paths Download |
Added: June 01, 2013 | Visits: 436
This MATLAB(R) script generates a real time plot of voltage values collected from an Agilent(TM) 34401A Digital Multimeter over the serial port(RS232). The data is collected and plotted until the predefined stop time is reached. This example also demonstrates automating a query based interaction...
Platforms: Matlab
| License: Shareware | Cost: $0.00 USD | Size: 10 KB | Download (45): Collect and plot data from an instrument in real time Download |
Added: May 22, 2013 | Visits: 370
real time data plot from a serial portThis matlab script is for plotting a graph by accessing serial port data in real time. Change the com values and all variable values accroding to your requirements. Do not forget to add terminator in to your serial device program.
Platforms: Matlab
| License: Shareware | Cost: $0.00 USD | Size: 10 KB | Download (42): Real time Data plot from serial port Download |
Added: April 24, 2013 | Visits: 392
By entering the appropriate orbital elements, you can plot the orbit around a 3D view of Earth. The funcion also allows for click-and-drag camera manipulation. You can also do a fly-by.Enjoy!
Platforms: Matlab
| License: Shareware | Cost: $0.00 USD | Size: 40.96 KB | Download (42): orbits - plot orbits around Earth in an interactive manner. Download |
Added: September 10, 2013 | Visits: 427
Take a set of speed or distance data with a direction and create a radar-like plot...
Platforms: Matlab
| License: Shareware | Cost: $0.00 USD | Size: 10 KB | Download (43): Radar-like Plot Download |
Added: June 22, 2013 | Visits: 376
Plot a set of stacked bars, but group them according to labels provided.Params: stackData is a 3D matrix (i.e., stackData(i, j, k) => (Group, Stack, StackElement)) groupLabels is a CELL type (i.e., { 'a', 1 , 20, 'foo' };)
Platforms: Matlab
| License: Shareware | Cost: $0.00 USD | Size: 10 KB | Download (43): Plot Groups of Stacked Bars Download |
Added: June 21, 2013 | Visits: 395
This function creates a shaded contour plot, similar to that created by the contourf function. However, the relationship between a contourf plot and its colormap (i.e. exactly which color corresponds to each contour interval), can often be confusing and inconsistent, especially if your contour...
Platforms: Matlab
| License: Shareware | Cost: $0.00 USD | Size: 10 KB | Download (40): contourfcmap: filled contour plot with precise colormap Download |
Added: June 04, 2013 | Visits: 613
I would like to plot figure(10000) using double axis, see line number 217and I would like to make a movie file of the figure formed using the loop which is from line number 161 to line number 189
Platforms: Matlab
| License: Freeware | Size: 20.48 KB | Download (40): would like to plot using double axis Download |