


Scatter Plot Activities software
Scatter Plot Activities
Added: August 13, 2013 | Visits: 575
 This function plot in the same figure the center trajectory and attitude of an aircraft. See the figure to understand better.The version 2.0, extend the functionality of version 1. In this version there are much more body models [for example the tomcat (see the figure), the shuttle, the mig,...
Platforms: Matlab
| License: Freeware | Size: 1.74 MB | Download (43): Trajectory and Attitude Plot Version 2 Download |
Added: June 08, 2013 | Visits: 344
Data density can be hard to read from scatter plots due to overstriking. I therefore calculate data density at each pixel as the reciprocal of the sum of squared distance from each point, adding a fudge factor to prevent points actually within the pixel going to infinity.The resulting plot allow...
Platforms: Matlab
| License: Shareware | Cost: $0.00 USD | Size: 10 KB | Download (39): Data density plot Download |
Added: April 12, 2013 | Visits: 613
Syntax: plotdata; plotdata(hPlotFig); plotdata(figureName,sheetName,xdata,ydata, xAxisName,yHeaders,...); [hDataFig, hSpreadsheet] = plotdata(...); PLOTDATA(hPlotFig) scans the supplied figure handle for any plot axes; for each plot axes found, a new spreadsheet is created with the plot data...
Platforms: Matlab
| License: Freeware | Size: 40.96 KB | Download (46): PlotData - display plot raw-data in data-tables Download |
Added: August 20, 2013 | Visits: 422
How do you turn a collection of XYZ triplets into a surface plot? This is the most frequently asked 3D plotting question that I got when I was in Tech Support. This submission explains how.
Platforms: Matlab
| License: Shareware | Cost: $0.00 USD | Size: 92.16 KB | Download (44): Making Surface Plots From Scatter Data Download |
Added: July 18, 2013 | Visits: 320
Little function to plot a 3D scatter of semi-transparent spheres (as opposed to dots). Very improvable, specially regarding adding optional parameters for the spheres characteristics: number of facets, transparency, etc. It can represent three quantities as: height (Z), color and size for each...
Platforms: Matlab
| License: Shareware | Cost: $0.00 USD | Size: 10 KB | Download (43): scatter3sph Download |
Added: August 14, 2013 | Visits: 498
This Function calculates two important matrices, the Within (W) and Between (B) scatter matrixCOMMENTS CORRECTED IN FUNCTIONFunction takes as input a matrix and calculates two important matrices, the Within (W) and Between (B) Class Scatter Matrix. Highly useful in statistical learning field.
Platforms: Matlab
| License: Shareware | Cost: $0.00 USD | Size: 10 KB | Download (46): Within and Between Class Scatter Matrix Download |
Added: April 14, 2013 | Visits: 586
I wrote this to plot some overlapping data sets with there means and regions of +/- std deviations shown. It could be used for other purposes though.
Platforms: Matlab
| License: Freeware | Size: 10 KB | Download (47): Plot Overlapping Regions With Lines Download |
Released: March 17, 2017
|
Added: April 04, 2017 | Visits: 894
 Panda preschool activities app is a collection of 70 exciting educational games for your preschool children (Grades Pre-K and K).
- Available for Android & iOS devices and Windows desktop.
Features:
Developed by California credentialed teachers.
70 different games that teach kids about...
Panda preschool activities app is a collection of 70 exciting educational games for your preschool children (Grades Pre-K and K).
- Available for Android & iOS devices and Windows desktop.
Features:
Developed by California credentialed teachers.
70 different games that teach kids about...
Platforms: Windows 8, Windows 7, Windows
| License: Shareware | Cost: $7.99 USD | Size: 21.79 KB | Download (816): Panda Preschool Activities Download |
Released: March 17, 2017
|
Added: April 19, 2017 | Visits: 827
 Panda preschool activities - 3 app is a collection of 70 exciting educational games for your preschool children (Grades Pre-K and K).
Available for Android & iOS devices and Windows desktop.
Features Include
Developed by California credentialed teachers.
70 different games that teach kids...
Panda preschool activities - 3 app is a collection of 70 exciting educational games for your preschool children (Grades Pre-K and K).
Available for Android & iOS devices and Windows desktop.
Features Include
Developed by California credentialed teachers.
70 different games that teach kids...
Platforms: Windows 8, Windows 7, Windows
| License: Shareware | Cost: $7.99 USD | Size: 17.47 KB | Download (813): Panda Preschool Activities - 3 Download |
Added: November 22, 2006 | Visits: 4.579
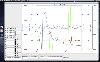
 Rt-Plot is a tool to generate Cartesian X/Y-plots from scientific data. You can enter and calculate tabular data. View the changing graphs, including linear and non linear regression, interpolation, differentiation and integration, during entering. Rt-Plot enables you to create plots fast and...
Platforms: Windows
| License: Shareware | Cost: $50.00 USD | Size: 5.56 MB | Download (195): Rt-Plot Download |
Released: June 03, 2016
|
Added: July 19, 2016 | Visits: 1.758
 Scientific data visualization software. Creating vertex, grid and surface model, Delaunay triangles, color map, contour plot, vector plot, 3D contour plot, 4D scatter, 4D slice and 4D vector.Creating graphs of regular data and irregular data. Creating vertex, grid and surface model, Delaunay...
Platforms: Windows, Windows 7, Windows Server
| License: Demo | Cost: $150.00 USD | Size: 3.15 MB | Download (144): Visual Data Download |
Added: August 13, 2008 | Visits: 1.085
Time, Money & Activities gives you some interesting statistics on buying and time spending habits over your lifetime. If you've ever wondered how much money you could save by kicking the smoking habit or how much time you spend watching tv compared to the amount of time you devote to your kids,...
Platforms: Windows
| License: Freeware | Size: 580 KB | Download (489): Time, Money and Activities Download |
Released: June 09, 2012
|
Added: June 09, 2012 | Visits: 463
 Time, Money & Activities gives you some interesting statistics on buying and time spending habits over your lifetime. If you've ever wondered how much money you could save by kicking the smoking habit or how much time you spend watching tv compared to the amount of time you devote to your kids,...
Platforms: Windows
| License: Freeware | Size: 580 KB | Download (44): Time Money and Activities Download |
Released: August 24, 2012
|
Added: August 24, 2012 | Visits: 555
 Coulson Plot Generator application creates a multiple pie diagram, for comparing subunit occupancy across a range of entities. Numbers of pies, segments, labels and colours are customisable. Creates an editable PDF from a comma separated text file.
Platforms: Windows, Mac, Solaris, Linux
| License: Freeware | Size: 150.49 KB | Download (47): Coulson Plot Generator Download |
Released: June 18, 2012
|
Added: June 18, 2012 | Visits: 345
Portable Plot is a pure ansi/iso c++ plot library that makes the construction of native plot widgets easy.
Platforms: Windows, Mac, Linux
| License: Freeware | Size: 456.67 KB | Download (45): portable plot Download |
Released: November 21, 2012
|
Added: November 21, 2012 | Visits: 427
 DAQ Plot is a simple to use strip chart application that permits real-time viewing and analysis of signals. Use simulated signals to understand data logging concepts without additional hardware and the inexpensive DLP-IO8-G data acquisition hardware (purc
Platforms: Mac
| License: Shareware | Cost: $14.99 USD | Size: 12.4 MB | Download (62): DAQ Plot Download |
Added: July 11, 2013 | Visits: 470
The available function to draw the Nyquist plot doesn't give the proper image of function. So here is the code to get the clear image.
Platforms: Matlab
| License: Freeware | Size: 10 KB | Download (39): Matlab, Nyquist, Power system, Plots, Nyquist plot. Download |
Added: July 11, 2013 | Visits: 284
%%%Plots a Bland-Altman Plot %%%INPUTS: %%% var1 and var2 - vectors of the measurements %%%flag - how much you want to plot %%% 0 = no plot %%% 1 = just the data %%% 2 = data and the difference and CR lines %%% 3 = above and a linear fit %%% %%%OUTPUTS: %%% means = the means of the data %%% diffs...
Platforms: Matlab
| License: Shareware | Cost: $0.00 USD | Size: 10 KB | Download (43): Bland Altman Plot Download |
Added: July 11, 2013 | Visits: 445
The script plots the envelope of the bode plot for a parametric uncertain/interval system.interval_bode(NumVec,DenVec,clr)The function accepts the numerator (NumVec) and denominator (DenVec) of the uncertain system as matrices of two rows each. The first row containing the lower bounds and the...
Platforms: Matlab
| License: Freeware | Size: 10 KB | Download (43): Interval Bode Plot Download |
Added: March 27, 2013 | Visits: 464
This function makes an imagesc-like plot for two matrices with equal dimensions, in which each each cell of the plot is split diagonally with the upper triangle of cell (i,j) in the plot representing the Matrix1(i,j) and the lower triangle representing Matrix2(i,j).
Platforms: Matlab
| License: Freeware | Size: 10 KB | Download (43): Overlay 2 matrices in an imagesc-like plot Download |