


Plotting Mfc software
Plotting Mfc
Added: May 15, 2013 | Visits: 465
 There are 23 different functions performing basic orbital operations (Hohmann tx, inclination and node changes, orbital parameter conversions, ground tracks, orbit plotting, etc.). Some of these functions are still rough, so please provide feedback. These functions are basically how I did all of...
Platforms: Matlab
| License: Freeware | Size: 573.44 KB | Download (46): Orbital Mechanics Library Download |
Added: March 23, 2013 | Visits: 476
A Simple Pack of Tools for Plotting Lattices and Crystals and Calculating Their Properties. Description is in each file.
Platforms: Matlab
| License: Freeware | Size: 102.4 KB | Download (46): Solid State Physics Simulation Pack Download |
Added: August 01, 2013 | Visits: 424
These routines allow easy plotting of lines or contours with hatches on one side. This line style is often used to represent a constraint, where one side of the line represents a no-go area.
Platforms: Matlab
| License: Freeware | Size: 10 KB | Download (39): Hatched Lines and Contours Download |
Added: April 24, 2013 | Visits: 528
From undergraduate chemistry, we know how to test whether a reaction is 0th, 1st, or 2nd order by plotting different transformations of the data, and inspecting which plot fits the best.This program does the same thing. It transforms the data using different values of the order, attempting to...
Platforms: Matlab
| License: Freeware | Size: 10 KB | Download (40): orderseek - Finds chemical reaction order Download |
Added: May 01, 2013 | Visits: 350
Maple is a great tool for symbolic manipulation and is also very smart at plotting expressions, handling discontinuities,etc.However the plot customization and export possibilities are very primitive. Also, often I want to superimpose Maple plots with other data. This is very clumsy to handle in...
Platforms: Matlab
| License: Freeware | Size: 10 KB | Download (47): ReadMaplePlot Download |
Added: September 03, 2013 | Visits: 358
SimDriver enables Matlab users to scan local M-files to detect simulation parameters and results in order to automize related sensitivity analysis and plotting via dedicated GUI .SimDriver delivery embeds on-line help and training example .SimDriver download comes with a one year license .
Platforms: Matlab
| License: Freeware | Size: 10 KB | Download (41): SimDriver Download |
Added: June 28, 2013 | Visits: 394
function [h1, h2] = plot_dir3 (vX, vY, vZ) Plotting x-y-z variables with direction indicating vector to the next element. Example vX = linspace(0,2*pi, 10)'; vY = sin (vX); vZ = cos (vX); plot_dir3(vX, vY, vZ);
Platforms: Matlab
| License: Shareware | Cost: $0.00 USD | Size: 10 KB | Download (41): Plot With Direction 3D Download |
Added: May 23, 2013 | Visits: 293
No plotting utilities are included. You can use this submission for reading and related submissions for plotting.
Platforms: Matlab
| License: Shareware | Cost: $0.00 USD | Size: 512 KB | Download (42): read_teqc_compact Download |
Added: June 07, 2013 | Visits: 448
A simple gui design shows the ability to make dynamic plotting by changing the value of slider which produce a change in the circle radius.
Platforms: Matlab
| License: Shareware | Cost: $0.00 USD | Size: 10 KB | Download (49): Resize a circle using slider by gui Download |
Added: June 08, 2013 | Visits: 383
The function plotting 3-dimensional lines (or pathes) as pipes.
Platforms: Matlab
| License: Shareware | Cost: $0.00 USD | Size: 10 KB | Download (45): pipe_plot Download |
Added: September 04, 2013 | Visits: 630
ykcee is an easy-to-use highly configurable chart plotting php class.Right at the moment ykcee can do bars, lines, areas, linepoints, dots and pie-charts. The complete layout is highly configurable.
Platforms: PHP
| License: Freeware | Size: 225.28 KB | Download (43): ykcee for Scripts Download |
Added: August 12, 2013 | Visits: 255
Core Plot is a plotting framework for Mac OS X and iOS. It provides 2D visualization of data, and is tightly integrated with Apple technologies like Core Animation, Core Data, and Cocoa Bindings.
Platforms: Mac
| License: Freeware | Size: 9.57 MB | Download (40): Core Plot Download |
Added: August 11, 2013 | Visits: 436
This is a python package which serves a (so far very inimalistic) plotting API through a xmlrpc server. The plots are generated by Gnuplot. The purpose of this package is to monitor long running computations without interfering with it, i.e. slowing it down. Multiple plot servers can be...
Platforms: *nix
| License: Freeware | Size: 10.24 KB | Download (32): liveplots Download |
Added: August 19, 2013 | Visits: 512
PyXPlot is a command-line data processing, graph plotting and vector graphics tool.
Platforms: *nix
| License: Freeware | Size: 3.67 MB | Download (35): PyXPlot Download |
Released: December 01, 2013
|
Added: January 15, 2014 | Visits: 868
 STIMATH is a high-level tool for mathematics, linear algebra, plotting and expression evaluation that can be used from any programming environment or even from a command line interface. It is an executable that takes a single argument, the name of a text file containing a series of MATLAB style...
Platforms: Windows 7
| License: Commercial | Cost: $50.00 USD | Size: 292.97 KB | Download (46): STIMATH Download |
Added: January 01, 2006 | Visits: 7.926
 3D Grapher is a feature-rich yet easy-to-use graph plotting and data visualization software suitable for students, engineers and everybody who needs to work with 2D and 3D graphs. With 3D Grapher you can easily plot the equation and table-based graphs, zoom them, rotate, view at any angle and...
Platforms: Windows
| License: Shareware | Cost: $24.95 USD | Size: 728 KB | Download (936): 3D Grapher Download |
Released: March 09, 2009
|
Added: August 15, 2014 | Visits: 6.348
 Powerful but easy-to-use graphing, curve fitting and calculating software. Graphs Cartesian (Y(x) and X(y)), polar and parametric functions, graphs of tables, equations (implicit functions), inequalities and slope fields. Up to 100 graphs in one window. Calculus features: regression analysis,...
Platforms: Windows
| License: Shareware | Cost: $29.95 USD | Size: 1.38 MB | Download (698): Advanced Grapher Download |
Added: April 20, 2006 | Visits: 3.081
Form++ Library provides Microsoft Foundation Class (MFC)/Visual C++ developers with a complete library of MFC extension classes which implement a drag and drop (e.g. VC,VB Form Editor) graphical interface. These classes fill many of the holes existing in the Windows Graphics Device Interface...
| License: Shareware | Cost: $249.00 USD | Size: 3.91 MB | Download (195): Form++ Library Download |
Added: November 01, 2006 | Visits: 14.949
 ImageDIG consists of three integrated modules which allow the user to convert 2D flat images into 3D (x,y,z) data or if a graph, convert the graph in image form into 2 dimensional numerical data. The third module is a full analysis plotting utility where the user can import either the 2D or 3D...
Platforms: Windows
| License: Shareware | Cost: $89.95 USD | Size: 5.67 MB | Download (580): ImageDIG 2D/3D image digitizer Download |
Added: March 26, 2006 | Visits: 2.581
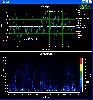 PlotLab is a set of Visual C++ components for very easy and fast Data Visualization. The library includes: Scope - scientific chart component for plotting multi-channel data. Waterfall - l data plotting component, especially suitable for FFT results. The components allow zooming, navigation,...
Platforms: Windows
| License: Shareware | Cost: $190.00 USD | Size: 8.88 MB | Download (187): PlotLab VC++ Download |