


Plot Utm Coordinates software
Plot Utm Coordinates
Added: April 12, 2013 | Visits: 613
 Syntax: plotdata; plotdata(hPlotFig); plotdata(figureName,sheetName,xdata,ydata, xAxisName,yHeaders,...); [hDataFig, hSpreadsheet] = plotdata(...); PLOTDATA(hPlotFig) scans the supplied figure handle for any plot axes; for each plot axes found, a new spreadsheet is created with the plot data...
Platforms: Matlab
| License: Freeware | Size: 40.96 KB | Download (46): PlotData - display plot raw-data in data-tables Download |
Added: April 29, 2013 | Visits: 771
Convert WGS 84 (CTS, ECEF) Coordinates to ECI (CIS, Epoch J2000.0) Coordinates. This function has been vectorized for speed. The associated error in converting between coordinate frames is on the order of 1.2*10^-11 km when compared to STK ephemeris output.To run this function type the following...
Platforms: Matlab
| License: Shareware | Cost: $0.00 USD | Size: 10 KB | Download (57): Convert ECEF to ECI Coordinates Download |
Added: May 29, 2013 | Visits: 318
USAGE===== This function enables a 3D array to be displayed using a patch surface mesh. To plot a 3D logical array, the function is called using the following syntax: >> hpat = PATCH_3Darray(gridINPUT,gridX,gridY,gridZ); Alternatively, a 3D numeric array can be plotted such that the colour of...
Platforms: Matlab
| License: Shareware | Cost: $0.00 USD | Size: 92.16 KB | Download (46): Plot a 3D array using patch Download |
Added: April 11, 2013 | Visits: 347
the function gets x-y-z coordinates and calculate the x-y coordinates for the left-eye and the right-eye images.a demo script demonstrate the function, red/blue 3D glasses is needed.
Platforms: Matlab
| License: Shareware | Cost: $0.00 USD | Size: 10 KB | Download (47): 3D plot (stereoscopy) Download |
Added: June 27, 2013 | Visits: 319
Rotates the given coordinates about a given center using either degrees or radians. Results are suitable for use with 'plot' function.
Platforms: Matlab
| License: Shareware | Cost: $0.00 USD | Size: 10 KB | Download (40): Coordinate Rotation Download |
Added: April 14, 2013 | Visits: 586
I wrote this to plot some overlapping data sets with there means and regions of +/- std deviations shown. It could be used for other purposes though.
Platforms: Matlab
| License: Freeware | Size: 10 KB | Download (47): Plot Overlapping Regions With Lines Download |
Added: August 12, 2013 | Visits: 443
The Local Coordinates model displays the position of a star in local (Altitude/Azimuth) coordinates. The horizon is shown along with the four cardinal directions (N, E, S, and W). The latitude of the observer is set at 35.5 degrees which sets the location of the north celestial pole (teal)...
Platforms: Mac
| License: Freeware | Size: 10.24 KB | Download (35): Local Coordinates Model Download |
Added: November 22, 2006 | Visits: 4.579
 Rt-Plot is a tool to generate Cartesian X/Y-plots from scientific data. You can enter and calculate tabular data. View the changing graphs, including linear and non linear regression, interpolation, differentiation and integration, during entering. Rt-Plot enables you to create plots fast and...
Platforms: Windows
| License: Shareware | Cost: $50.00 USD | Size: 5.56 MB | Download (195): Rt-Plot Download |
Added: August 23, 2008 | Visits: 1.001
 Compute simple arithmetic to high-precision calculations (up to 60 digits), render beautiful 2D/3D graphics and histogram/scatter plot quickly with smart formatting, trace your graphic coordinates and send professional reports in seconds. Enter your data as a vector, fraction, any angle,...
Platforms: Windows
| License: Shareware | Cost: $49.95 USD | Size: 2.23 MB | Download (104): Fornux Calculator Student Edition Download |
Released: November 20, 2015
|
Added: April 20, 2016 | Visits: 3.083
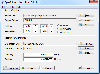 The Eye4Software Coordinate Calculator is an easy to use tool to perform map or GPS coordinate conversions. The software can be used to transform a single coordinate or a batch of coordinates read from a comma separated, database or ESRI shapefiles. The software is shipped with a MS Access...
Platforms: Windows, Windows 7
| License: Shareware | Cost: $119.00 USD | Size: 8.96 MB | Download (243): Eye4Software Coordinate Calculator Download |
Added: July 27, 2010 | Visits: 1.553
IP-Atlas tries to plot your location or any other host on the internet using the NetGeo data. It finds the latitude and longitude coordinates of the host and plots it on an image for you.It finds the latitude and longitude coordinates of the host and plots it on an image for you. You can try the...
Platforms: *nix
| License: Freeware | Size: 93.18 KB | Download (128): IP-Atlas Download |
Released: June 10, 2011
|
Added: July 07, 2011 | Visits: 1.422
 Be compatible with all CAD systems! The reliable Plot Viewer. Normica View can view, print and plot bitmaps and plot data, HP-GL/2 incl. RTL, PCL5, HP-GL from all CAD systems. Normica View is made for Windows 7 / 2008 (32 & 64 Bit). It is recommended and used by the hotlines of HP, XEROX, Océ,...
Platforms: Windows, Other
| License: Demo | Cost: $282.48 USD | Size: 10.07 MB | Download (98): Normica View Download |
Released: January 09, 2013
|
Added: January 09, 2013 | Visits: 571
UTM (Universal Traffic Manager) is a professional billing system for Internet Service Providers. The core of the system, written in C++, is a smart and reliable accounting engine working directly with network equipment. It supports up to 100,000 users at a total speed of up to 3 Gbps.
All...
Platforms: Linux
| License: Demo | Cost: $700.00 USD | Size: 16.8 MB | Download (47): UTM for Linux 5.1.10-016 Download |
Released: August 24, 2012
|
Added: August 24, 2012 | Visits: 555
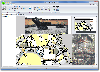
 Coulson Plot Generator application creates a multiple pie diagram, for comparing subunit occupancy across a range of entities. Numbers of pies, segments, labels and colours are customisable. Creates an editable PDF from a comma separated text file.
Platforms: Windows, Mac, Solaris, Linux
| License: Freeware | Size: 150.49 KB | Download (47): Coulson Plot Generator Download |
Released: November 05, 2012
|
Added: November 05, 2012 | Visits: 370
At the current state, opengeodb provide geo coordinates and several other data (city name, zip) mainly for the german speaking area.
Platforms: Windows, Mac, Linux
| License: Freeware | Size: 2.82 MB | Download (47): open geo coordinates database Download |
Added: September 10, 2013 | Visits: 473
Plot Digitizer is a Java program used to digitize scanned plots of functional data. Often data is found presented in reports and references as functional X-Y type scatter or line plots. In order to use this data, it must somehow be digitized. This program will allow you to take a scanned image of...
Platforms: Mac
| License: Freeware | Size: 1.16 MB | Download (47): Plot Digitizer Download |
Released: June 18, 2012
|
Added: June 18, 2012 | Visits: 345
Portable Plot is a pure ansi/iso c++ plot library that makes the construction of native plot widgets easy.
Platforms: Windows, Mac, Linux
| License: Freeware | Size: 456.67 KB | Download (45): portable plot Download |
Released: November 21, 2012
|
Added: November 21, 2012 | Visits: 427
 DAQ Plot is a simple to use strip chart application that permits real-time viewing and analysis of signals. Use simulated signals to understand data logging concepts without additional hardware and the inexpensive DLP-IO8-G data acquisition hardware (purc
Platforms: Mac
| License: Shareware | Cost: $14.99 USD | Size: 12.4 MB | Download (62): DAQ Plot Download |
Added: July 11, 2013 | Visits: 471
The available function to draw the Nyquist plot doesn't give the proper image of function. So here is the code to get the clear image.
Platforms: Matlab
| License: Freeware | Size: 10 KB | Download (39): Matlab, Nyquist, Power system, Plots, Nyquist plot. Download |
Added: September 11, 2013 | Visits: 510
Convert ECI (CIS, Epoch J2000.0) Coordinates to WGS 84 (CTS, ECEF) Coordinates. This function has been vectorized for speed.Example Function Call:>> [r_ECEF v_ECEF] = ECItoECEF(JD,r_ECI,v_ECI);Where:JD is the Julian Date vector [1 x N] (units are in days)r_ECI is the position vector [3 x N] (any...
Platforms: Matlab
| License: Freeware | Size: 10 KB | Download (46): Convert ECI to ECEF Coordinates Download |