


Plot Graph Function software
Plot Graph Function
Added: August 02, 2013 | Visits: 280
 Do you find yourself repeatedly typing "figure; plot(A(:,1), B(:,2), 'r'; hold on; plot(B(:,1), B(:,2), 'g')" or something similar? Then this function is for you. "fp" makes it easy to plot multiple data sets with minimal typing. It also tiles the figure windows and adds convenience buttons for...
Platforms: Matlab
| License: Shareware | Cost: $0.00 USD | Size: 10 KB | Download (42): Quick figure and plot Download |
Added: July 07, 2013 | Visits: 471
This function can be used to generate spiderweb plots for continuous maps of the interval [0 1] into itself.This type of graph is used to visualize successive iterations of an interval map f. Given an initial point x0, the segments that make up the diagram connect the points (x0, f(x0)), (f(x0),...
Platforms: Matlab
| License: Shareware | Cost: $0.00 USD | Size: 10 KB | Download (44): Spiderweb Plot for Interval Maps Download |
Added: May 21, 2013 | Visits: 363
This is an example of how to create an line plot in MATLABdlT«.Read about the plot function in the MATLABdlT« documentation.
Platforms: Matlab
| License: Shareware | Cost: $0.00 USD | Size: 10 KB | Download (39): MATLAB Plot Gallery - Line Plot 2D (1) Download |
Added: August 06, 2013 | Visits: 520
This function generates mesh plot with 3Dbars at specific (x,y) points by using fill3 function.This function uses MATLAB's fill3.m meant to generate Filled 3-D polygons.
Platforms: Matlab
| License: Shareware | Cost: $0.00 USD | Size: 20.48 KB | Download (50): Generating surface plot with bars at specific (x,y) points Download |
Added: August 06, 2013 | Visits: 486
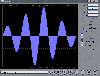
Simple PLOT , ZOOM and FFT for various oscilloscpope, Simulink or Matlab data formats No input parameter is required to start the program. Input data are selected and loaded from the top-level (start) GUI --->> GetData_vxx.fig.Implements the selection of a workspace variable generated in the...
Platforms: Matlab
| License: Shareware | Cost: $0.00 USD | Size: 112.64 KB | Download (47): Simple Plot, Zoom and FFT GUI Download |
Added: August 22, 2013 | Visits: 325
Plots each data point as a box, and puts each box on the graph in such a way that no boxes overlap. By default produces a standalone plot in a new figure window, but can plot into specified axes as well. See the comments in the function help for more detail.
Platforms: Matlab
| License: Shareware | Cost: $0.00 USD | Size: 10 KB | Download (41): Generate a Dotplot Download |
Added: June 28, 2013 | Visits: 278
This version of "plot" will allow you to visualize data that has very large number of elements. Plotting large data set makes your graphics sluggish, but most times you don't need all of the information displayed in the plot. Your screen only has so many pixels, and your eyes won't be able to...
Platforms: Matlab
| License: Shareware | Cost: $0.00 USD | Size: 10 KB | Download (47): DSPLOT - downsampled plot Download |
Added: May 22, 2013 | Visits: 491
"Plot to Bitmap" allows the user to directly plot lines, text and filled polygons into an image, thus without taking a screen-shot (getframe).This function is also useful if you want to convert a few coordinates describing a region contour into a bitmap of the region.
Platforms: Matlab
| License: Shareware | Cost: $0.00 USD | Size: 10 KB | Download (41): Plot to Bitmap Download |
Added: July 17, 2013 | Visits: 194
This function fixes a string before it is used as a title for a graph.It is known that an underscore '_' is used in the title string to set the next character to lowercase. But, in many cases we don't need this feature, we just want to print the underscore. The correct way is to insert the '_'...
Platforms: Matlab
| License: Shareware | Cost: $0.00 USD | Size: 10 KB | Download (39): Fix string for graph title Download |
Added: June 29, 2013 | Visits: 360
For analysing measurements (or simulations) it is often necessary to plot different graphs from an array of data. Some graphs have one line, other have more.PLOTMAT is a function to do this. Given an array of data, and an array for which columns have to be plotted in which graphs, the graphs are...
Platforms: Matlab
| License: Shareware | Cost: $0.00 USD | Size: 10 KB | Download (39): Plot different graphs at once Download |
Added: May 15, 2013 | Visits: 351
Arrowline 3-D vector plot.vectarrow(p0,p1) plots a line vector with arrow pointing from point p0 to point p1. The function can plot both 2D and 3D vector with arrow depending on the dimension of the inputExample: For 3D vector p0 = [1 2 3]; p1 = [4 5 6]; vectarrow(p0,p1) For 2D vector p0 = [1 2];...
Platforms: Matlab
| License: Shareware | Cost: $0.00 USD | Size: 10 KB | Download (46): Plot 2D/3D Vector with Arrow Download |
Added: June 30, 2013 | Visits: 390
Produces the digial representation of a straight line suitable for use with matrices and the 'plot' function.
Platforms: Matlab
| License: Shareware | Cost: $0.00 USD | Size: 10 KB | Download (42): plot_line.m Download |
Added: September 11, 2013 | Visits: 486
Knowledgering Post Popularity Graph Tool displays a horizontal graph that represents the popularity of a post based on comments, views, ratings, facebook likes and retweets. Views and ratings are measured only if WP Postviews and GD Star Rating plugins are installed and active. Facebook likes and...
Platforms: PHP
| License: Freeware | Size: 102.4 KB | Download (49): Knowledgering Post Popularity Graph Tool Download |
Added: September 15, 2013 | Visits: 443
The Ejs Wave Function Plotter model displays a one-dimensional wave function u(x,t) depicting a disturbance at position x and time t. The disturbance can be mass density, pressure, or electric field depending on the physical context. The default wave function is sinusoidal but any other analytic...
Platforms: Mac
| License: Shareware | Cost: $0.00 USD | Size: 1.2 MB | Download (36): Wave Function Plotter Model Download |
Added: October 05, 2013 | Visits: 410
Draw a graph of any function and see graphs of its derivative and integral. Don't forget to use the magnify/demagnify controls on the y-axis to adjust the scale.
Platforms: Mac
| License: Shareware | Cost: $0.00 USD | Size: 358.4 KB | Download (38): Calculus Grapher Download |
Added: June 15, 2013 | Visits: 369
The Function Visualizer Model displays the graph of a function f(x) with arbitrary parameters. The function can contain polynomial, trigonometric, and exponential expressions as well a parameters. Parameters are connected to sliders that can be adjusted to observe the effect of varying parameter...
Platforms: Mac
| License: Shareware | Cost: $0.00 USD | Size: 747.52 KB | Download (40): Function Visualizer Model Download |
Released: January 11, 2014
|
Added: January 26, 2014 | Visits: 662
 This software utility can plot regular or parametric functions, in Cartesian or polar coordinate systems, and is capable to evaluate the roots, minimum and maximum points as well as the first derivative and the integral value of regular functions. Easy to use, ergonomic and intuitive interface,...
Platforms: Windows, Windows 7
| License: Shareware | Cost: $15.00 USD | Size: 1.18 MB | Download (72): WinDraw Download |
Added: August 22, 2006 | Visits: 2.918
 GraphSight Junior is an easy to use freeware handy 2D math-graphing program. It was originally designed to help students and teachers satisfy their day-after-day math plotting needs. It makes it easy to plot and explore common Y(X) = F(X) Cartesian graphs, set text labels on the coordinate plane,...
Platforms: Windows
| License: Freeware | Size: 393 KB | Download (726): GraphSight Junior Download |
Added: March 22, 2006 | Visits: 3.136
Plot Observer is an AutoCAD add-on utility that silently records all print/plot activity in AutoCAD. Plot Observer records billing information, page size/sqaure footage, plotter name, and user information for each print/plot run in AutoCAD. Plot Observer records data in a central log file for...
Platforms: Windows
| License: Shareware | Cost: $120.00 USD | Size: 3.32 MB | Download (169): Plot Observer Download |
Added: October 06, 2006 | Visits: 6.202
 Fly-through 3D graph software for exciting presentations, marketing, sales, analysis and fun! Capture the attention of your audience with spectacular 3D technology. Instead of showing your audience another boring line graph, capture their interest with something wildly different. They will be...
Platforms: Windows
| License: Shareware | Cost: $40.00 USD | Size: 6.54 MB | Download (843): 3D Graph Generator Download |