


Plot Data Graph software
Plot Data Graph
Released: September 10, 2012
|
Added: September 10, 2012 | Visits: 691
 QtGrace is a small, easy to use application specially designed to offer users a program to display or plot data, analyze data and prepare it for printing.
This software is special because it combines the convenience of a graphical user interface with the power of a scripting language which...
Platforms: Windows, Windows Vista, 7
QtGrace is a small, easy to use application specially designed to offer users a program to display or plot data, analyze data and prepare it for printing.
This software is special because it combines the convenience of a graphical user interface with the power of a scripting language which...
Platforms: Windows, Windows Vista, 7
| License: Freeware | Download (454): QtGrace Download |
Added: October 14, 2010 | Visits: 1.657
GD::Graph is a graph plotting module for Perl 5. SYNOPSIS use GD::Graph::moduleName; GD::Graph is a perl5 module to create charts using the GD module. The following classes for graphs with axes are defined: GD::Graph::lines Create a line chart. GD::Graph::bars and GD::Graph::hbars...
Platforms: *nix
| License: Freeware | Size: 143.36 KB | Download (111): GD::Graph Download |
Added: April 12, 2013 | Visits: 622
Syntax: plotdata; plotdata(hPlotFig); plotdata(figureName,sheetName,xdata,ydata, xAxisName,yHeaders,...); [hDataFig, hSpreadsheet] = plotdata(...); PLOTDATA(hPlotFig) scans the supplied figure handle for any plot axes; for each plot axes found, a new spreadsheet is created with the plot data...
Platforms: Matlab
| License: Freeware | Size: 40.96 KB | Download (46): PlotData - display plot raw-data in data-tables Download |
Added: June 01, 2013 | Visits: 440
This MATLAB(R) script generates a real time plot of voltage values collected from an Agilent(TM) 34401A Digital Multimeter over the serial port(RS232). The data is collected and plotted until the predefined stop time is reached. This example also demonstrates automating a query based interaction...
Platforms: Matlab
| License: Shareware | Cost: $0.00 USD | Size: 10 KB | Download (45): Collect and plot data from an instrument in real time Download |
Added: April 27, 2013 | Visits: 467
Plot data in a figure, and then interactively choose regression area. The result from polyfit is returned.Example:x=1:1:10;y=sin(x);f=figure; plot( x,y );[p,h] = figreg( f, 2 );%fit a second order polynom to selected region in plot
Platforms: Matlab
| License: Shareware | Cost: $0.00 USD | Size: 10 KB | Download (43): Interactive regression on a plot Download |
Released: June 10, 2011
|
Added: July 07, 2011 | Visits: 1.431
 Be compatible with all CAD systems! The reliable Plot Viewer. Normica View can view, print and plot bitmaps and plot data, HP-GL/2 incl. RTL, PCL5, HP-GL from all CAD systems. Normica View is made for Windows 7 / 2008 (32 & 64 Bit). It is recommended and used by the hotlines of HP, XEROX, Océ,...
Platforms: Windows, Other
Be compatible with all CAD systems! The reliable Plot Viewer. Normica View can view, print and plot bitmaps and plot data, HP-GL/2 incl. RTL, PCL5, HP-GL from all CAD systems. Normica View is made for Windows 7 / 2008 (32 & 64 Bit). It is recommended and used by the hotlines of HP, XEROX, Océ,...
Platforms: Windows, Other
| License: Demo | Cost: $282.48 USD | Size: 10.07 MB | Download (98): Normica View Download |
Added: January 13, 2010 | Visits: 1.376
Chart::Scientific is a Perl module that can generate simple 2-D scientific plots with logging, errbars, etc. SYNOPSIS Procedural interface use Chart::Scientific qw/make_plot/; make_plot ( x_data => @x_values, y_data => @yvalues ); The subroutine make_plot creates a Chart::Scientific...
Platforms: *nix
| License: Freeware | Size: 16.38 KB | Download (109): Chart::Scientific Download |
Added: July 10, 2013 | Visits: 346
basemap is an add-on toolkit for Matplotlib that lets you plot data on map projections with coastlines, lakes, rivers and political boundaries. See http://scipy.org/Cookbook/Matplotlib/Maps for an example of what it can do.
Platforms: *nix
| License: Freeware | Size: 98.63 MB | Download (35): basemap Download |
Added: September 03, 2010 | Visits: 2.147
SVG::Graph is a Perl module to visualize your data in Scalable Vector Graphics (SVG) format. SYNOPSIS use SVG::Graph; use SVG::Graph::Data; use SVG::Graph::Data::Datum; #create a new SVG document to plot in... my $graph = SVG::Graph->new(width=>600,height=>600,margin=>30); #and create...
Platforms: *nix
| License: Freeware | Size: 88.06 KB | Download (151): SVG::Graph Download |
Released: August 27, 2008
|
Added: September 02, 2008 | Visits: 1.495
 Imagine a complete Graphing solution assisting you right from importing data and manipulating data, plotting graphs, customizing looks, saving and exporting your graphs as high quality images and producing dynamic reports of your data in a matter of a few easy steps.
Features:
- Data...
Platforms: Windows
Imagine a complete Graphing solution assisting you right from importing data and manipulating data, plotting graphs, customizing looks, saving and exporting your graphs as high quality images and producing dynamic reports of your data in a matter of a few easy steps.
Features:
- Data...
Platforms: Windows
| License: Demo | Cost: $99.00 USD | Size: 8.12 MB | Download (134): Grapholic Download |
Added: May 10, 2013 | Visits: 365
It can be used to plot only discrete data, not having support for mathematical functions. Limitations: - Does not support functions. - Don't suit all applciations.
Platforms: Windows, Mac, *nix, Python, BSD Solaris
| License: Freeware | Download (54): Graphication Download |
Released: September 28, 2015
|
Added: October 06, 2015 | Visits: 363
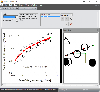 Obtain data from images of graphs scanned from articles or available as image. Import the graph into ScanIt from a scanner or file, or from the clipboard. Define locations of the graph's axes by indicating known points. Extract data from the graph by manually picking points, by scanning for...
Platforms: Windows, Windows 8, Windows 7, Windows Server
Obtain data from images of graphs scanned from articles or available as image. Import the graph into ScanIt from a scanner or file, or from the clipboard. Define locations of the graph's axes by indicating known points. Extract data from the graph by manually picking points, by scanning for...
Platforms: Windows, Windows 8, Windows 7, Windows Server
| License: Freeware | Size: 6.11 MB | Download (38): ScanIt Download |
Released: September 12, 2012
|
Added: September 12, 2012 | Visits: 707
DataScene Professional is a scientific application that helps you design graphs and graph animation. It is also capable to perform data analysis, curve fitting, and data monitoring.
It allows the user to easily plot 2D & 3D graphs (Area, Bar, Pie, Line, Surface, Ploar, and more), to manipulate,...
Platforms: Windows
| License: Freeware | Download (459): DataScene Professional Download |
Released: October 06, 2012
|
Added: October 06, 2012 | Visits: 389
 DataScene is a data graphing, animation, and analysis software package. It allows the user to easily plot 2D & 3D graphs (Area, Bar, Pie, Line, Surface, Ploar, and more) with scientific, financial, and statistical data, to manipulate, print, and export high quality graphs.
DataScene can also...
Platforms: Windows
DataScene is a data graphing, animation, and analysis software package. It allows the user to easily plot 2D & 3D graphs (Area, Bar, Pie, Line, Surface, Ploar, and more) with scientific, financial, and statistical data, to manipulate, print, and export high quality graphs.
DataScene can also...
Platforms: Windows
| License: Shareware | Cost: $219.00 USD | Size: 46.6 MB | Download (452): DataScene Deluxe Download |
Released: June 19, 2012
|
Added: June 19, 2012 | Visits: 577
 Origin is a software application with tools for data analysis, publication-quality graphing, and programming. Visit our Top Features page to find out what's new in the latest version. Data Analysis Origin contains powerful tools for all of your analytic needs, including peak analysis, curve...
Platforms: Windows
Origin is a software application with tools for data analysis, publication-quality graphing, and programming. Visit our Top Features page to find out what's new in the latest version. Data Analysis Origin contains powerful tools for all of your analytic needs, including peak analysis, curve...
Platforms: Windows
| License: Shareware | Cost: $50.00 USD | Size: 369 MB | Download (49): Origin 8.6 SR Download |
Added: May 10, 2013 | Visits: 562
This vertical bar graph is done completely using DHTML and CSS. Unlike an applet based solution, this loads fast and blends in with the rest of the page. You can even use a transparent background for it.
Platforms: Windows, Mac, *nix, JavaScript, BSD Solaris
| License: Freeware | Download (58): DHTML / CSS based bar graph Download |
Added: November 13, 2010 | Visits: 1.504
Cacti is a complete network graphing solution designed to harness the power of RRDTools data storage and graphing functionality. Cacti project provides a fast poller, advanced graph templating, multiple data acquisition methods, and user management features out of the box. All of this is...
Platforms: *nix
| License: Freeware | Size: 1.1 MB | Download (117): Cacti Download |
Released: August 19, 2012
|
Added: August 19, 2012 | Visits: 401
The Plot.py project tries to supply an easy to use measurement data visualization and treatment framework being easy to use while keeping the freedom for advanced users to execute additional data treatment algorithms. The program is build on a object oriented modular basis to provide the...
Platforms: Linux
| License: Freeware | Download (441): Plotting GUI for Linux Download |
Released: November 26, 2012
|
Added: November 26, 2012 | Visits: 382
The Plot.py project tries to supply an easy to use measurement data visualization and treatment framework being easy to use while keeping the freedom for advanced users to execute additional data treatment algorithms. The program is build on a object oriented modular basis to provide the...
Platforms: Windows
| License: Freeware | Size: 41.9 MB | Download (503): Plotting GUI Download |
Released: November 19, 2012
|
Added: November 19, 2012 | Visits: 345
 The Plot.py project tries to supply an easy to use measurement data visualization and treatment framework being easy to use while keeping the freedom for advanced users to execute additional data treatment algorithms. The program is build on a object oriented modular basis to provide the...
Platforms: Linux
The Plot.py project tries to supply an easy to use measurement data visualization and treatment framework being easy to use while keeping the freedom for advanced users to execute additional data treatment algorithms. The program is build on a object oriented modular basis to provide the...
Platforms: Linux
| License: Freeware | Size: 850 KB | Download (485): Plotting GUI for Linux 0.7.13 Beta Download |