


Plot software
Plot
Released: July 12, 2012
|
Added: July 12, 2012 | Visits: 437
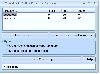 Plot multiple functions in MS Excel. Excel 2000 or higher required.
Platforms: Windows
Plot multiple functions in MS Excel. Excel 2000 or higher required.
Platforms: Windows
| License: Shareware | Cost: $19.99 USD | Size: 769 KB | Download (508): Excel Graph Multiple Equations Software Download |
Released: June 13, 2012
|
Added: June 13, 2012 | Visits: 452
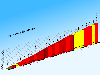 CycloGraph is a handy program to help you plot the gradient of roads using distances and heights. An Open Source alternative to Salitaker for plotting the profile of the roads you are planning to do with your bicycle. It also can import routes from kml. FEATURES: · import kml files · open...
Platforms: Windows
CycloGraph is a handy program to help you plot the gradient of roads using distances and heights. An Open Source alternative to Salitaker for plotting the profile of the roads you are planning to do with your bicycle. It also can import routes from kml. FEATURES: · import kml files · open...
Platforms: Windows
| License: Freeware | Size: 16.2 MB | Download (504): CycloGraph Download |
Released: November 26, 2012
|
Added: November 26, 2012 | Visits: 382
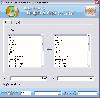
 The Plot.py project tries to supply an easy to use measurement data visualization and treatment framework being easy to use while keeping the freedom for advanced users to execute additional data treatment algorithms. The program is build on a object oriented modular basis to provide the...
Platforms: Windows
The Plot.py project tries to supply an easy to use measurement data visualization and treatment framework being easy to use while keeping the freedom for advanced users to execute additional data treatment algorithms. The program is build on a object oriented modular basis to provide the...
Platforms: Windows
| License: Freeware | Size: 41.9 MB | Download (503): Plotting GUI Download |
Released: November 19, 2012
|
Added: November 19, 2012 | Visits: 345
 The Plot.py project tries to supply an easy to use measurement data visualization and treatment framework being easy to use while keeping the freedom for advanced users to execute additional data treatment algorithms. The program is build on a object oriented modular basis to provide the...
Platforms: Linux
The Plot.py project tries to supply an easy to use measurement data visualization and treatment framework being easy to use while keeping the freedom for advanced users to execute additional data treatment algorithms. The program is build on a object oriented modular basis to provide the...
Platforms: Linux
| License: Freeware | Size: 850 KB | Download (485): Plotting GUI for Linux 0.7.13 Beta Download |
Released: September 10, 2012
|
Added: September 10, 2012 | Visits: 691
QtGrace is a small, easy to use application specially designed to offer users a program to display or plot data, analyze data and prepare it for printing.
This software is special because it combines the convenience of a graphical user interface with the power of a scripting language which...
Platforms: Windows, Windows Vista, 7
| License: Freeware | Download (454): QtGrace Download |
Released: August 23, 2012
|
Added: August 23, 2012 | Visits: 754
Function Plot 2D with Sections is a small, simple, Java based application specially designed to help you create function plots.
Function Plot 2D lets you create a 2D plot, all you need to do is give an input function.
for WindowsAll
Platforms: Windows
| License: Freeware | Download (449): Function Plot 2D with Sections Download |
Released: August 23, 2012
|
Added: August 23, 2012 | Visits: 708
Function Plot 2D is a small, simple, Java based application specially designed to help you create function plots.
Function Plot 2D lets you create a 2D plot, all you need to do is give an input function.
for WindowsAll
Platforms: Windows
| License: Freeware | Download (443): Function Plot 2D Download |
Released: August 19, 2012
|
Added: August 19, 2012 | Visits: 401
The Plot.py project tries to supply an easy to use measurement data visualization and treatment framework being easy to use while keeping the freedom for advanced users to execute additional data treatment algorithms. The program is build on a object oriented modular basis to provide the...
Platforms: Linux
| License: Freeware | Download (441): Plotting GUI for Linux Download |
Released: June 07, 2012
|
Added: June 07, 2012 | Visits: 469
PlotDWGarr is an Autocad plugin designed to enable you to plot a rectangular array of drawings from the DWG modelspace or to generate a set of layouts.
If you get a DWG drawing which contains multiple frames (with individual drawings) composed as an array in the modelspace, you can use the...
Platforms: Windows
| License: Freeware | Download (425): PlotDWGarr Download |
Added: March 23, 2006 | Visits: 4.333
 GraphSight is a convenient tool to plot and explore 2D math functions. You may plot several function in the same window, create several coordinate spaces defined by different variables (not only those y and x), set labels on the plot, use custom user-defined constants in every formula. All of the...
Platforms: Windows
GraphSight is a convenient tool to plot and explore 2D math functions. You may plot several function in the same window, create several coordinate spaces defined by different variables (not only those y and x), set labels on the plot, use custom user-defined constants in every formula. All of the...
Platforms: Windows
| License: Shareware | Cost: $19.00 USD | Size: 406 KB | Download (334): GraphSight Download |
Released: November 11, 2007
|
Added: March 24, 2008 | Visits: 4.926
 Area converter and price calculator software is available free of cost. Tool installation wizard makes easy to install the software on your computer on various version of windows operating system like 98, ME, NT, 2000, 2003 server, XP, VISTA. Software can figure out cost of shop, office, homes,...
Platforms: Windows
Area converter and price calculator software is available free of cost. Tool installation wizard makes easy to install the software on your computer on various version of windows operating system like 98, ME, NT, 2000, 2003 server, XP, VISTA. Software can figure out cost of shop, office, homes,...
Platforms: Windows
| License: Freeware | Size: 759 KB | Download (302): Area Conversion and Price Calculator Download |
Added: November 22, 2006 | Visits: 4.585
 Rt-Plot is a tool to generate Cartesian X/Y-plots from scientific data. You can enter and calculate tabular data. View the changing graphs, including linear and non linear regression, interpolation, differentiation and integration, during entering. Rt-Plot enables you to create plots fast and...
Platforms: Windows
Rt-Plot is a tool to generate Cartesian X/Y-plots from scientific data. You can enter and calculate tabular data. View the changing graphs, including linear and non linear regression, interpolation, differentiation and integration, during entering. Rt-Plot enables you to create plots fast and...
Platforms: Windows
| License: Shareware | Cost: $50.00 USD | Size: 5.56 MB | Download (195): Rt-Plot Download |
Added: March 22, 2006 | Visits: 3.138
Plot Observer is an AutoCAD add-on utility that silently records all print/plot activity in AutoCAD. Plot Observer records billing information, page size/sqaure footage, plotter name, and user information for each print/plot run in AutoCAD. Plot Observer records data in a central log file for...
Platforms: Windows
| License: Shareware | Cost: $120.00 USD | Size: 3.32 MB | Download (169): Plot Observer Download |
Added: January 09, 2010 | Visits: 2.552
Chart::Plot::Canvas is a Perl module to plot two dimensional data in an Tk Canvas. SYNOPSIS use Chart::Plot::Canvas; my $img = Chart::Plot::Canvas->new(); my $anotherImg = Chart::Plot::Canvas->new ($image_width, $image_height); $img->setData (@dataset) or die( $img->error() );...
Platforms: *nix
| License: Freeware | Size: 5.12 KB | Download (162): Chart::Plot::Canvas Download |
Added: July 27, 2010 | Visits: 1.562
IP-Atlas tries to plot your location or any other host on the internet using the NetGeo data. It finds the latitude and longitude coordinates of the host and plots it on an image for you.It finds the latitude and longitude coordinates of the host and plots it on an image for you. You can try the...
Platforms: *nix
| License: Freeware | Size: 93.18 KB | Download (128): IP-Atlas Download |
Released: July 07, 2012
|
Added: July 07, 2012 | Visits: 919
 Universal oscilloscope GUI ( Real-time plot ) DLL library for data acquisition, simulation, debugging.Advantages:1.Speedy performance: the library makes it possible to bring out into the beams of the viewing oscilloscope over a million quantization steps of signal per second (on the Pentium III...
Platforms: Windows, Windows Vista
Universal oscilloscope GUI ( Real-time plot ) DLL library for data acquisition, simulation, debugging.Advantages:1.Speedy performance: the library makes it possible to bring out into the beams of the viewing oscilloscope over a million quantization steps of signal per second (on the Pentium III...
Platforms: Windows, Windows Vista
| License: Freeware | Size: 3.54 MB | Download (127): Universal Software Oscilloscope Library Download |
Released: January 12, 2012
|
Added: February 04, 2012 | Visits: 1.501
 Bubble maps software does scatter plot and circle charts in Excel, useful for advanced business analysis.
Excel provides the ability to draw bubble maps and scatter plots, but they are less refined than a bubble map you can make with the Smart Bubble Charts software. In Excel: (1) Chart...
Platforms: Windows
Bubble maps software does scatter plot and circle charts in Excel, useful for advanced business analysis.
Excel provides the ability to draw bubble maps and scatter plots, but they are less refined than a bubble map you can make with the Smart Bubble Charts software. In Excel: (1) Chart...
Platforms: Windows
| License: Shareware | Cost: $54.65 USD | Size: 16.32 MB | Download (126): Bubble Maps Software Download |
Added: January 22, 2010 | Visits: 1.655
Chart::Plot is a Perl module to plot two dimensional data in an image. SYNOPSIS use Chart::Plot; my $img = Chart::Plot->new(); my $anotherImg = Chart::Plot->new ($image_width, $image_height); $img->setData (@dataset) or die( $img->error() ); $img->setData (@xdataset, @ydataset);...
Platforms: *nix
| License: Freeware | Size: 15.36 KB | Download (116): Chart::Plot Download |
Added: January 25, 2010 | Visits: 829
Plot is a scientific 2D plotting program for Mac OS X. Plot is designed for everyday plotting, it is easy to use, it creates high quality plots, it allows easy and powerful manipulations and calculations of data, and it is free.Available Features: ASCII, Binary, MySQL, SciPlot and Perl based...
Platforms: Mac
| License: Freeware | Download (115): Plot Download |
Added: February 08, 2010 | Visits: 1.270
Chemistry::Artificial::Graphics is a graphic plot for artificial with database support. SYNOPSIS use strict; use Chemistry::SQL; use Chemistry::Artificial::Graphics; my $dbname = $ARGV[0]; my $chaname = $ARGV[1]; my $file = $ARGV[2]; my $mode = $ARGV[3]; if (scalar(@ARGV)!=4) {...
Platforms: *nix
| License: Freeware | Size: 14.34 KB | Download (112): Chemistry::Artificial::Graphics Download |