


Line Plots Plotting Data software
Line Plots Plotting Data
Added: January 18, 2010 | Visits: 1.274
 Data::Encrypted is a Perl module to transparently store encrypted data via RSA. SYNOPSIS # functional interface: use Data::Encrypted file => "./.$0-encrypted-data", qw(encrypted); # note: login and password are not *really* the login and # password values, only the desired prompt! my...
Platforms: *nix
| License: Freeware | Size: 7.17 KB | Download (94): Data::Encrypted Download |
Added: September 03, 2010 | Visits: 2.146
SVG::Graph is a Perl module to visualize your data in Scalable Vector Graphics (SVG) format. SYNOPSIS use SVG::Graph; use SVG::Graph::Data; use SVG::Graph::Data::Datum; #create a new SVG document to plot in... my $graph = SVG::Graph->new(width=>600,height=>600,margin=>30); #and create...
Platforms: *nix
| License: Freeware | Size: 88.06 KB | Download (151): SVG::Graph Download |
Added: October 14, 2010 | Visits: 1.655
GD::Graph is a graph plotting module for Perl 5. SYNOPSIS use GD::Graph::moduleName; GD::Graph is a perl5 module to create charts using the GD module. The following classes for graphs with axes are defined: GD::Graph::lines Create a line chart. GD::Graph::bars and GD::Graph::hbars...
Platforms: *nix
| License: Freeware | Size: 143.36 KB | Download (111): GD::Graph Download |
Added: January 25, 2010 | Visits: 2.926
Graphing and Data AnalysisDon't just graph your data - learn from it!KaleidaGraph is an award-winning graphing and data analysis solution that is rich in features yet affordably priced. This unique application distinguishes itself in the technical marketplace with its powerful curve fitting,...
Platforms: Mac
| License: Demo | Cost: $0.00 USD | Size: 13.1 MB | Download (256): KaleidaGraph Download |
Released: January 07, 2013
|
Added: January 07, 2013 | Visits: 888
 To be able to test a database application which works with MS Access, you need test data. If possible, realistic data. You can make this test data manually. That is quite error prone and very time consuming. The solution is Datanamic Data Generator for MS Access. This is a tool that generates...
Platforms: Windows
| License: Shareware | Cost: $99.00 USD | Size: 4.8 MB | Download (52): Datanamic Data Generator for MS Access Download |
Added: March 28, 2013 | Visits: 544
Example code from "Handling Large Data Sets Efficiently in MATLAB " webinar (http://www.mathworks.com/company/events/we.../wbnr30435.html) describing strategies for handling large amounts of data in MATLAB and avoiding "out-of-memory" errors. It will provide you with an understanding of the...
Platforms: Matlab
| License: Freeware | Size: 1.26 MB | Download (46): Handling Large Data Sets Efficiently in MATLAB Download |
Added: July 07, 2013 | Visits: 370
function [coef, RSquared]=plotdata(xi,yi,polyorder) A simple data plotting function, useful for inspecting x,y data. The function accepts data in the form of a single vector, a pair of vectors "x" and "y", or a single NxM or MxN matrix with the independent variable (x) in first row or column...
Platforms: Matlab
| License: Shareware | Cost: $0.00 USD | Size: 10 KB | Download (49): plotdata, version 2 Download |
Added: June 03, 2013 | Visits: 361
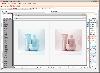
This zip files contains programs (five functions, one example program, and one sample data set) to plot data in ternary diagrams. The first option is a pseudo color plot, the second is a contour plot, and the third style plots the data as color coded symbols (similar to my function 'plot3c'). An...
Platforms: Matlab
| License: Shareware | Cost: $0.00 USD | Size: 20.48 KB | Download (40): Ternary Plots Download |
Released: March 14, 2019
|
Added: June 26, 2022 | Visits: 430
 VeryUtils PDF to Excel Converter Command Line is a command line application to extract tables from PDF files and save to CSV files. It can be installed on your web server and be used by multiple users in your network. VeryUtils PDF to Excel Converter Command Line is a program to convert Adobe PDF...
Platforms: Windows, Windows 8, Windows 7, Windows Server
| License: Shareware | Cost: $199.00 USD | Size: 77.93 MB | Download (105): VeryUtils PDF to Excel Converter Command Line Download |
Added: January 25, 2010 | Visits: 621
DataPlot grew out of DataTank, and shares the overall philosophy. DataPlot limits the type of data sets that it handles, and restricts drawing to standard 2D plotting, such as line plots, scatter, function fits. This reduced function set and one-window-design makes it much easier to use and most...
Platforms: Mac
| License: Demo | Cost: $0.00 USD | Download (97): DataPlot Download |
Released: August 08, 2012
|
Added: August 08, 2012 | Visits: 473
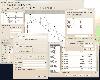 Veusz is a GUI scientific plotting and graphing package. It is designed to produce publication-ready Postscript or PDF output. SVG, EMF and bitmap export formats are also supported. The program runs under Unix/Linux, Windows or Mac OS X, and binaries are provided. Data can be read from text, CSV...
Platforms: Mac
| License: Freeware | Size: 10.2 MB | Download (432): Veusz for Mac OS X Download |
Released: September 10, 2012
|
Added: September 10, 2012 | Visits: 426
 Veusz is a GUI scientific plotting and graphing package. It is designed to produce publication-ready Postscript or PDF output. SVG, EMF and bitmap export formats are also supported. The program runs under Unix/Linux, Windows or Mac OS X, and binaries are provided. Data can be read from text, CSV...
Platforms: Linux
| License: Freeware | Size: 10.2 MB | Download (451): Veusz for Linux Download |
Released: November 09, 2012
|
Added: November 09, 2012 | Visits: 407
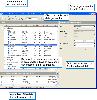
 SQL Studio Data Compare is an advanced data comparison utility for Microsoft SQL Server databases that helps to visualize changes in data and keeps databases in sync. Features high speed data analysis and generates instant results. The main functions are: comparing all tables or a custom...
Platforms: Windows
| License: Shareware | Cost: $45.00 USD | Size: 32.36 MB | Download (51): SQL Studio Data Compare Download |
Added: September 10, 2013 | Visits: 479
Plot Digitizer is a Java program used to digitize scanned plots of functional data. Often data is found presented in reports and references as functional X-Y type scatter or line plots. In order to use this data, it must somehow be digitized. This program will allow you to take a scanned image of...
Platforms: Mac
| License: Freeware | Size: 1.16 MB | Download (47): Plot Digitizer Download |
Added: March 30, 2013 | Visits: 441
Based on the Two line elements(TLE) - Input from the user, the program calculates the time and the date of the satellite pass. Prints out Azimuth and Elevation & plots it too.
Platforms: Matlab
| License: Freeware | Size: 153.6 KB | Download (47): GUI based Satellite Tracking System Download |
Added: May 14, 2013 | Visits: 540
Using the Instrument Control Toolbox, stream2excel.m reads data from an oscilloscope. Alternatively there is a companion data file that may be used instead. It filters the data to remove noise. It plots the data in an Excel spreadsheet using MATLAB's ActiveX interface.For more information, see...
Platforms: Matlab
| License: Freeware | Size: 10 KB | Download (44): Stream Instrument Data to Excel Using ActiveX Download |
Added: May 29, 2013 | Visits: 448
multiwaveplot(WAVE) draws a series of stacked waves (one on top of the other) contained in the rows of WAVE. Each wave has a designated row on the plot; the first row is plotted at the bottom of the plot.multiwaveplot(X,Y,WAVE) draws a series of wave centred on each element of Y, with x-data...
Platforms: Matlab
| License: Freeware | Size: 10 KB | Download (43): Multichannel Wave Plotting Download |
Added: August 11, 2008 | Visits: 1.337
 XML Converter with command-line interface is a data conversion software tool to interactively create XML data transformation. XML Converter with command-line interface unites data from ODBC, MS SQL Server, Oracle, MySQL databases, or from MS Office files into XML documents. It gives you ability...
Platforms: Windows
| License: Shareware | Cost: $99.99 USD | Size: 1.35 MB | Download (124): XML Converter CMD Download |
Added: October 07, 2010 | Visits: 917
DrasticTools can be used to visualize table data in a Grid (DrasticGrid) and on a Google Map (DrasticMap). The grid supports pagination, sorting, and in-line editing of data. DrasticTools project is the successor of MySQLPHPGrid. Whats New in This Release: - "showcols", "showcolsnot", and...
Platforms: *nix
| License: Freeware | Size: 83.97 KB | Download (106): DrasticTools Download |
Added: June 18, 2010 | Visits: 813
MRTGWebCfg is a tool for configuring MRTG through a Web-based interface. MRTG is an abbrevation of "Multi Router Traffic Grapher", which is a service, collecting data through SNMP queries and putting that data on a Web page. For instance, it can represent link load (incoming data rate,...
Platforms: *nix
| License: Freeware | Size: 41.98 KB | Download (100): MRTGWebCfg Download |